

TANDX Portfolio Update
Tandem has been very active in the month of January, trimming four names in the Castle Tandem Fund portfolio.
We pared back exposure in Amphenol Corporation and Costco Wholesale Corporation after the new year for valuation purposes. Amphenol is a global leader in broadband communications products. They provide high technology interconnect, sensor, and antenna solutions. The rush for 5G has helped Amphenol, as the company manufactures fiber optics.
Costco issued a special cash dividend of $15 per share that was paid out on January 12th. Their Q1 revenue was up 6.2% year-over-year and they saw a 6.1% increase in net sales, driven by consumer demand for value-priced staples.
We also trimmed Expeditors International of Washington, Inc. and SEI Investments Company. Expeditors was trimmed for valuation purposes, while SEI is having difficulty growing. Expeditors is a service-based logistics company that offers supply chain solutions. Their revenue segments are split into three: ocean freight & services, airfreight services, and customs brokerage & other services. SEI delivers technology and investment solutions. They are uniquely positioned in the wealth management industry to help with processing, operations, and management.
The Year that Pundits Got it Wrong
On January 2nd, 2023, the Wall Street Journal published an article that discussed the fact that more than two-thirds of economists at a collection of large financial institutions bet that the U.S. would have a recession in 2023. These firms said that Americans had spent through pandemic savings, the housing market was starting to decline, and banks were beginning to tighten their lending standards. According to these analysts, 2023 was not going to be pretty.
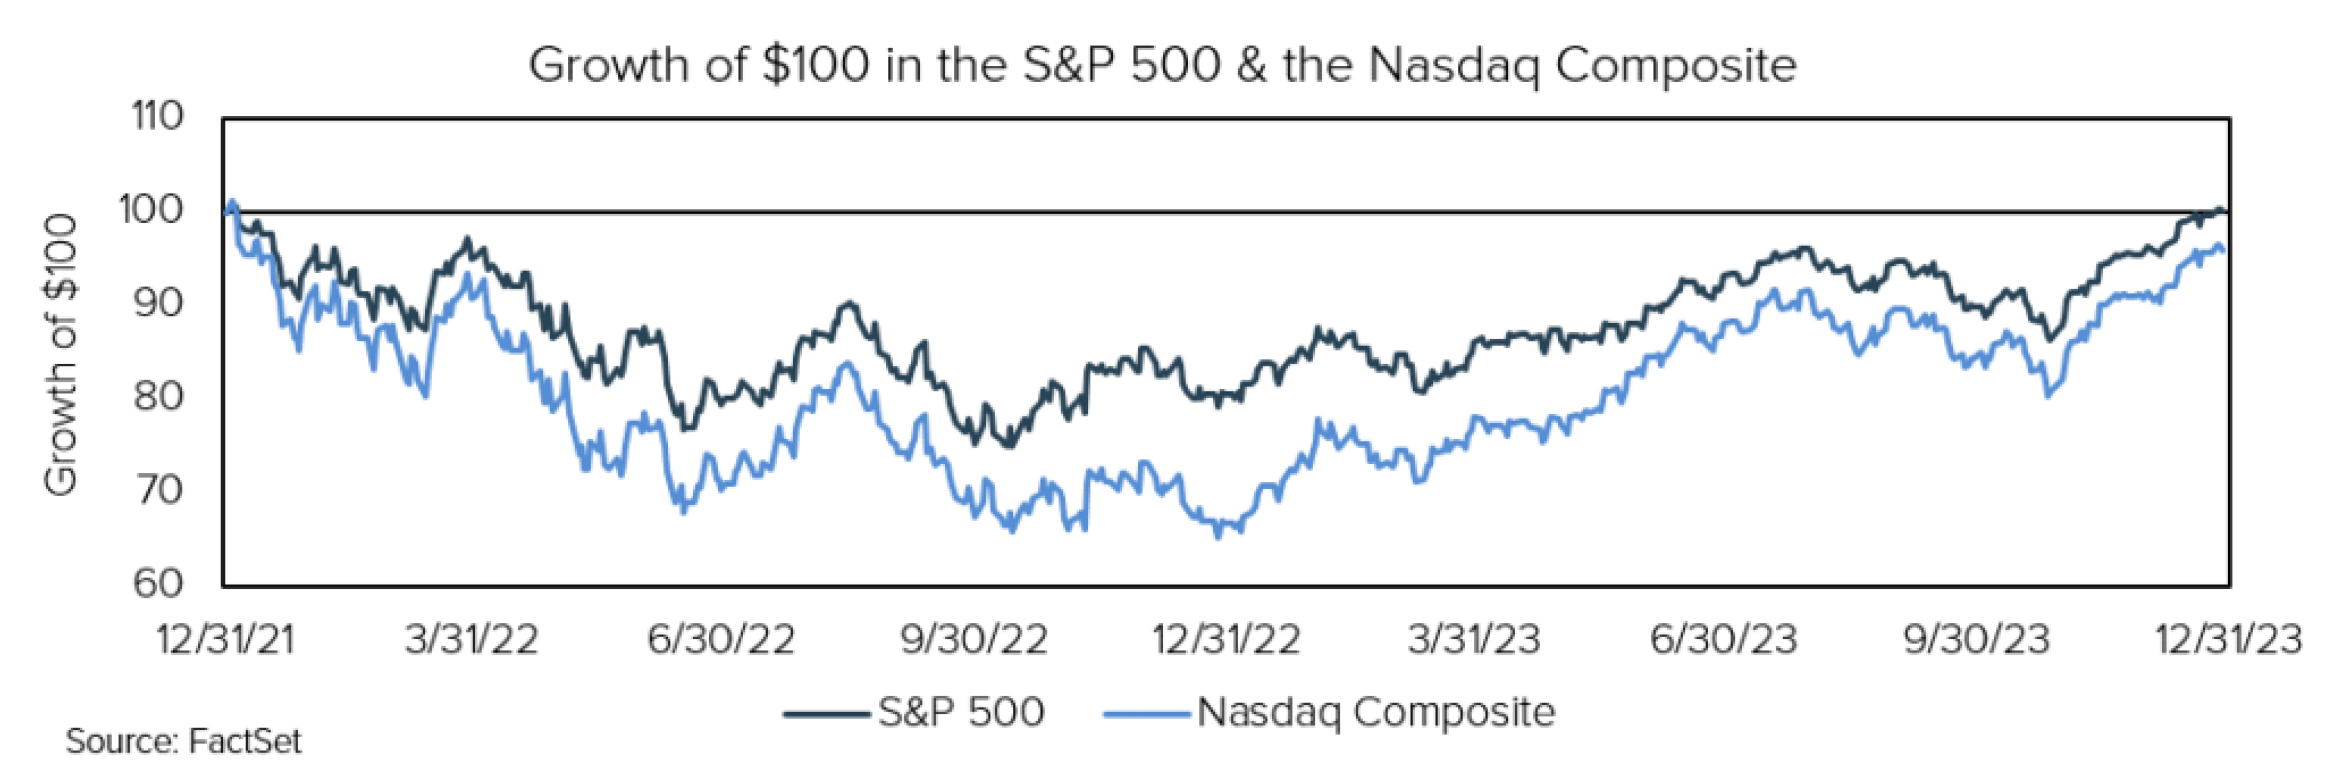
With the benefit of hindsight and with 2023 officially in the books, it is easy to say that most pundits were wrong about the year. Well, they were actually dead wrong. The S&P 500 gained more than 24%, nearly eclipsing its January 2022 levels by the end of 2023 (it did set a new all-time on January 19th, 2024), while the Nasdaq Composite gained more than 40%, boosted by the likes of AI and other big tech companies. The fourth quarter was especially strong. The S&P 500 closed higher in each of the final 9 weeks of the year – its longest winning streak since 2004. The S&P 500, Nasdaq Composite, Russell 2000, and the Dow Jones Industrial Average all posted double digits gains as well in Q4.
The year was largely driven by just seven companies, dubbed the Magnificent Seven (Apple, Microsoft, Alphabet, Amazon, Nvidia, Meta, and Tesla). Each of those stocks gained anywhere from ~50% to 240% in 2023. Remarkable. Of the 24% return in the S&P 500, those seven names accounted for nearly 2/3 of the total gain. In other words, the other 493 names contributed ~8%, while those 7 names contributed ~16%.
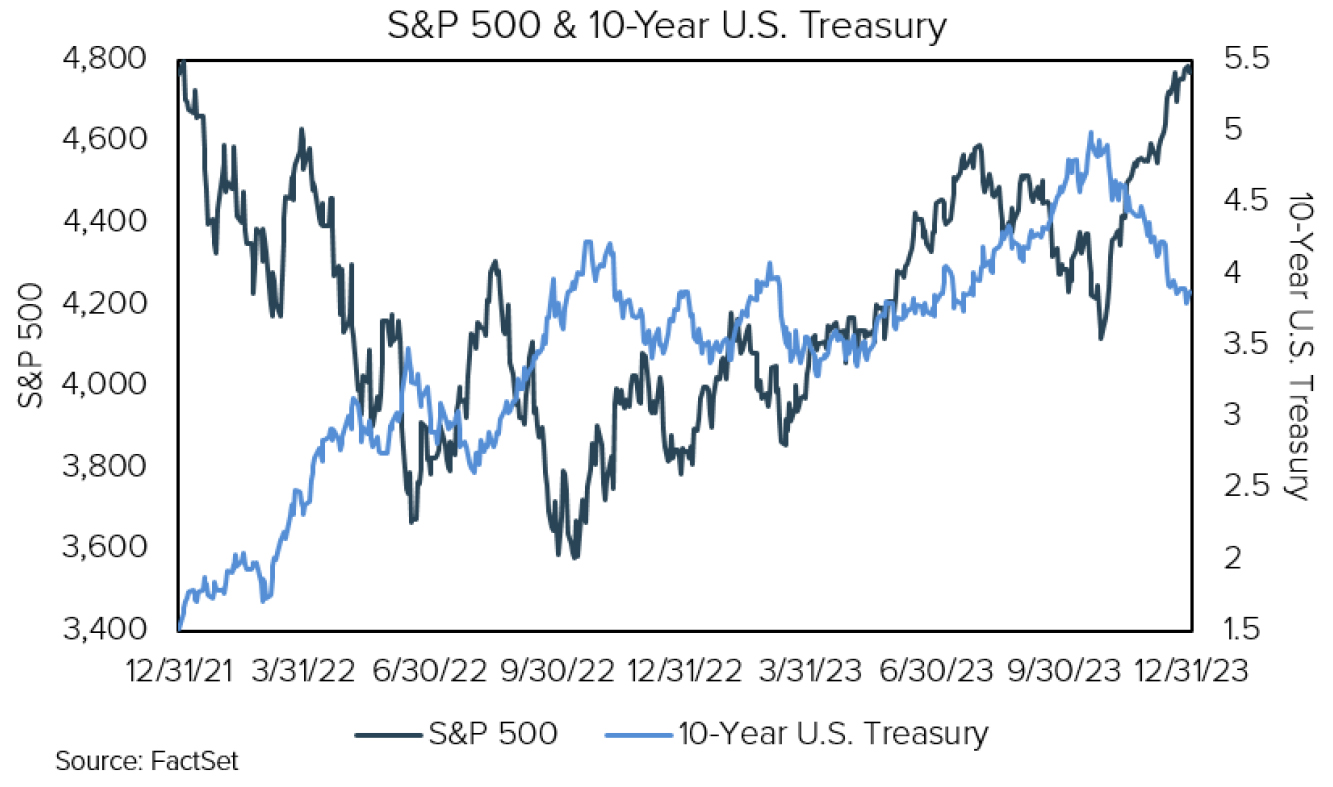
The disheartening year of 2022 was largely chalked up to the rapid rise in interest rates stemming from the rate hikes that came out of the Federal Reserve. When the Fed hikes rates, in theory, they are attempting to apply the brakes to the economy. This can often lead to slowdowns in the economy, or even recessions. This was one of the reasons why so many pundits thought the economy would recess heading into 2023. Rising interest rates have also often been seen as a headwind for equity valuations, which was one of the causes of the correction in stocks in 2022.
While the Magnificent Seven made for a catchy name and garnered much of the headlines throughout 2023, the most important drivers were still interest rates and the Federal Reserve. Last year, it was the expectation of rate cuts in 2024 that provided fuel for the move higher. Declining rates are generally perceived as good, and often cheered for the complete opposite of the reasons that rising rates are seen as bad. It is less expensive to borrow at lower rates, which means there can be more spending. Valuations can expand, which leads to higher asset prices. Generally speaking, financial conditions are easier when rates are low and tighter as rates rise. All in all, rates played a large role in what took place in 2023 and they look to remain center stage in 2024.
Coming into this year, the market thought that the Fed would cut rates six to seven times in 2024. In its own surveys, the Fed made it clear that they thought they would cut just three times in 2024. The Fed could be proven wrong, and the market could be proven right. However, it seems that the risk is in the market being proven wrong. That would mean that interest rates could be higher than the market currently anticipates. Higher rates again, historically, have been a headwind for equities.
According to FactSet, bearish talking points for markets in 2024 include the fact that economic indicators like household spending and corporate spending have decelerated. Bank surveys have also shown continued potential tightening of credit/lending standards. And, a recent survey from Bank of America showed that fund managers were their most optimistic since January 2022. Coincidentally, that was one of the last highs set by the S&P 500. Typically, when everyone agrees, it seems to be wrong. All those things, should they continue, do not spell doom, but they wouldn’t be my favorite ingredients for an investing backdrop either.
However, according to both Bloomberg and the Investment Company Institute, money-market funds came into the year at their highest levels ever, making it one of the most compelling bullish talking points. The theory goes, should interest rates move lower, money-market funds may become less compelling and some of that money could easily find its way into the stock market. That is a massive amount of dry powder that could work its way into the system. In fairness, some of that money will likely be spent. It’s also fair to say that some of those funds are not marked for investing, but rather for savings. Banks saw a rush of outflows last year as depositors left in droves to find more competitive rates of returns on their savings in the form of Treasury Bills or money-market funds. Perhaps in time, as banks offer more competitive rates, money market balances may decline to more normal levels without going into the stock market.
At times it can be hard to weigh the give and take in the market or in the economy. I could only give a haphazard guess at best as to what was going to happen in 2024. Fortunately, that is not how we invest at Tandem. We do not hold any sort of macro-opinion to inform our decision-making process. Instead, we just try to pay reasonable prices for companies that can hopefully grow regardless of the economic backdrop. That takes some of the guesswork off the table. It’s easy to own good businesses. It’s hard to guess what’s going to happen next in the economy, or the stock market, and make decisions from there.
Commentary
Investing Should be a Marathon, not a Sprint
In October’s Commentary (“The Big Get Bigger”), we discussed Tandem’s two pillars: 1) our desire to deliver a more consistent, repeatable, and less volatile investment experience and 2) our practicing of the discipline of buying low and selling high. To be frank, we could write about those two things each and every quarter. However, that would surely make for a rather boring quarterly newsletter. This quarter, we’d like to discuss risk and risk-adjusted returns. Specifically, how risk is considered by many investors and how risk feeds into our own evaluations of our efforts.
We believe that risk-adjusted returns are an important element in determining the success of one’s investment. Returns are very easily understood. 15% is better than 10%. Easy enough. So, during bull markets most investors pay attention to returns in their basic form, while not always considering the risks that they may be exposed to. A recent BlackRock article pointed out that in 2020 and 2021, investors were quite happy to own names like Meta, Amazon, Alphabet and Netflix. Those names outperformed the broader market. The returns were there – all was good. The risk of rising rates, which has historically hurt those mega-cap growth names, was not necessarily being considered, much to the chagrin of those same investors in 2022.
Our goal, as an investment team, is to be an efficient taker of risk. Risk can be defined in many ways. The U.S. Securities and Exchange Commission (SEC) defines risk as “the degree of uncertainty and/or potential financial loss inherent in an investment decision.” This definition of risk is fairly easy to understand. Picture all of us gathered around a table in Vegas playing Roulette. I chose to bet $100 on red. In American roulette, my odds of winning would be 47.4%. In other words, I would have a 47.4% chance to win $100 and a 52.6% chance of losing my $100. Fairly simple.
Yet that logic is less easy to apply when it comes to investing. How could one possibly and easily calculate expected potential losses and the probabilities of losing in investing? It’s impossible to do it as cleanly as one could standing around a roulette wheel. However, that doesn’t mean that this notion and definition of risk ought to be dismissed. On the contrary, it is still an important consideration, even if it is not how Tandem typically thinks about risk.
Picture two separate hypothetical portfolios. Portfolio A invests in all of the new AI-related startups. Portfolio B invests in more stable and mature names that can consistently grow their businesses through a variety of economic environments. If Portfolio A is successful, maybe the investment will rise 50%. Should the portfolio falter, maybe the value of the portfolio will be cut in half. If Portfolio B is successful, maybe the investment will grow 10% over the next year. If Portfolio B stumbles, maybe the portfolio will decline 10%. If both portfolios are a success, then the investor in Portfolio A looks much smarter than the one that invested in Portfolio B. After all, a 50% gain is no easy task. However, that is not so different from thinking that the most recent Powerball winner is also a genius for having the winning numbers. In both instances, the outcomes were successful – however, the investor in Portfolio A risked a much greater loss. If the two portfolios both falter, the investor in Portfolio B would likely feel better than the one in Portfolio A.
Amazon and cryptocurrencies are two great real-world examples of this concept. Amazon is undoubtedly one of the better investments one could have made 26 years ago. According to FactSet, Amazon has returned more than 155,000% since its IPO. For those that have experienced that investment performance, congratulations! You were able to hold onto the investment through a 47.5% drop in its first 6 days of trading, three separate 55% drawdowns between 1998 and 1999, a 95% decline in 2001, and a 65% drop in 2008. It is hard to have the fortitude to hold through all of those declines. I would wager that most of us would be unable to do so. Despite being one of the better assets one could have invested in, there was a lot of risk that could have shaken out the typical investor. Bitcoin and cryptocurrencies are similar. The returns have been astounding at times. The losses along the way have been so great that most of us stay away.
Warren Buffett once said, “The first rule of an investment is don’t lose [money]. And the second rule of an investment is don’t forget the first rule. And that’s all the rules there are.” It’s the losses that end up ruining us as investors. A 50% loss in Portfolio A is much more damaging than a 10% loss in Portfolio B. People are typically loss averse – that means that losing $50 is more painful than the joy we experience from gaining $50. Because of this, at Tandem, we believe it is crucial to deliver a more consistent and less volatile investment experience to hopefully minimize the pain from a loss. History has seen a litany of investors that have been littered by the wayside because of loss aversion. The pain felt from losses can cause panic, which can lead to selling low, which can lead to locking in losses permanently.
Losses can also lead to excessive risk-taking. If you have $100 and you lose half, you’d be left with $50. To get back to even, you would need to double your money, or make a 100% return. However, if you had $100 and you only lost a quarter, you would only need to gain 33% to get back to even. By protecting oneself to the downside, one does not need to take as much risk to the upside.
That brings me to how we at Tandem typically define risk – which is a little different from the SEC’s definition. Usually, when Tandem discusses risk, we are talking about the standard deviation, or volatility, of one’s returns. How much volatility does one introduce to achieve one’s returns? Let’s discuss two separate hypothetical investments. You put $100 in each. Investment A doubles in the first year, then loses half of its value before gaining 25% in year 3. By the end of three years, one would have $125. On the other hand, Investment B gains 7.77% in each of the three years. It too ends up at $125 after three years. To Tandem, Investment B is a more efficient and skillful taker of risk, and more importantly, produces a smoother ride. We would choose to be Investment B, not Investment A.
Now, there are a number of calculations that one could make to determine the efficiency with which one takes risk. At Tandem, our preferred metric is what we refer to as “Risk-Adjusted Returns”. To calculate this, one simply divides return by standard deviation of those returns and you end up with a number that tells you how much return one received for the amount of risk that was introduced. Take two portfolios which both returned 10%. The first had a deviation of 20%, and the second had a deviation of 10%. The former has a risk-adjusted return of 0.5 (10 ÷ 20 = 0.5), while the latter has a risk-adjusted return of 1 (10 ÷ 10 = 1). We would say that the second portfolio was better managed, all else equal.
Tandem again differs from most when we consider risk over time. Most evaluators of investment performance want to know what a manager or fund has returned over the past three years, five years, ten years, etc. This has always been a little nonsensical to us. The only time we would care about timeframes like that would be if we thought the next five years were going to look exactly like the past five years. What are the chances that the next five years see a global pandemic, unrivaled fiscal and monetary stimulus, incredible inflation, the rise of interest rates from near 0% to more than 5%, etc. Seems pretty low. So looking at a manager’s five year return tells me how they did in that environment, which we believe to be unhelpful for evaluating the next five years. Similarly, people will often want to discuss calendar year performance – but the race did not restart on January 1st of this year. No – the race is ongoing and perpetual.
Unfortunately, I do not have a crystal ball and if I did I would be sitting with my feet kicked back on a beach somewhere tropical. So, I can’t predict what will happen tomorrow, let alone what is going to happen over the next five years. To try to evaluate what will happen over the next five years by looking at the previous five seems unlikely to help me. Instead, we choose to focus on performance over a complete market cycle. A market cycle is defined as a period from an all-time high, to a low, back to all-time highs. The S&P 500 set an all-time high January 4, 2022. The low was set in October of 2022, and then the S&P 500 eclipsed that all-time high January 19, 2024. That is a complete market cycle. By evaluating performance over a complete market cycle, in our opinion, one is able to better judge a manager’s skill through all market’s rather than just one market.
From its October 2022 low through the end of 2023, the S&P 500 was up a little more than 37%. That seems great, but it pales in comparison to the Nasdaq’s nearly 50% return over that same time frame. Over those 15 months, in a market that went mostly higher – the Nasdaq was clearly the better index. However, evaluating the two over a complete market cycle tells a much different story. The Nasdaq, despite its 50% return through the end of the year, was still down a few percent from its January 4th, 2022 level, while the S&P 500 had set a new all-time high.
By evaluating performance over complete market cycles, we believe one is in a better position to assess the entire picture, rather than just a snapshot in time. One can see how a stock, portfolio, or strategy fairs through the good times and the bad – like the tortoise and the hare. If one only looks at one part of the race, they might think the hare is the better racer. By looking at the entire picture though, one can see that the slow and steady tortoise crosses the finish line ahead of the hare.
At Tandem, we aim to be the tortoise, not the hare. We aim to deliver a more consistent, repeatable, and less volatile experience. We want to grow your investment and do so with less volatility and we want to do so over complete market cycles – that is how we measure ourselves. We don’t pat ourselves on the back if we outperform in a month, quarter, or year. Nor do we beat ourselves up when we trail in any given month, quarter, or year. Those time periods are not relevant in our own internal evaluations. The race is longer than that.
The opinions expressed are those of the Fund’s Sub-Adviser and are not a recommendation for the purchase or sale of any security.
The Standard & Poors 500 Index (S&P 500) is an index of 500 stocks. The Russell 2000 Index measures the performance of the small-cap segment of the US equity universe. The Nasdaq Composite Index measures all Nasdaq domestic and international based common type stocks listed on The Nasdaq Stock Market. The Dow Jones Industrial Average is a price-weighted measure of 30 U.S. companies.
As of December 31, 2023 the Castle Tandem Fund held the following positions mentioned in this report: Microsoft Corp. (MSFT, 2.49% of Fund total net assets), Amphenol Corp. (APH, 2.97% of Fund total net assets), Costco Wholesale Corp. (COST, 1.90% of Fund total net assets), Expeditors International of Washington Inc (EXPD, 2.13% of Fund total net assets), and SEI Investments Company (SEIC, 2.07% of Fund total net assets). The Fund does not have a position in Apple, Alphabet, Amazon, NVIDIA, Meta, Tesla or Netflix.
The investment objectives, risks, charges and expenses of Castle mutual funds must be considered carefully before investing. The prospectus for each Fund contains this and other important information about the investment company, and it may be obtained by calling 1-877-743-7820, or visiting www.castleim.com. Read it carefully before investing.
Important Risk Information
The risks associated with the Fund are detailed in the Fund’s Prospectus. Investments in the Fund are subject to common stock risk, sector risk, and investment management risk. The Fund’s focus on large-capitalization companies subjects the Fund to the risks that larger companies may not be able to attain the high growth rates of smaller companies. Because the Fund may invest in companies of any size, its share price could be more volatile than a fund that invests only in large-capitalization companies. Fund holdings and asset allocations are subject to change and are not recommendations to buy or sell any security.
Distributed by Arbor Court Capital, LLC – Member FINRA / SIPC
Comments are closed.