

The Pause that Refreshes?
For the first time since January, the S&P 500 experienced a down month. While we certainly don’t celebrate down months, they are welcome from time-to-time. Markets aren’t meant to go up in a straight line.
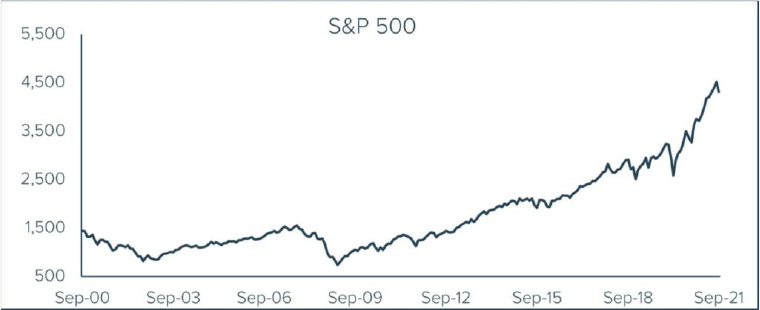
From March 2020 through August 2021, the S&P’s average monthly return was 3.43%. That is a blistering pace that translates to more than 40% annually. The September decline of 4.76% means the monthly average since the COVID sell-off is now a mere 2.97%, which is still a blistering pace. For the year, the S&P is up 14.68%, and for the last 12 months it has advanced 28.09%. These are very heady returns indeed.
The market’s advance has been fueled by impressive earnings growth and persistently low interest rates. The September selloff was brought on by a bit of doubt as to the sustainability of these two key ingredients. Companies are beginning to warn that supply chain woes and rising input costs could squeeze profits. In addition, evidence (or at the very least concern) mounts that inflation is with us to stay. These two concerns bring Federal Reserve policy into the spotlight, and if both concerns come to fruition, the Fed will have quite the conundrum.
The typical Fed response to lower profits, if there were to be one, would most likely be lowering interest rates. Just to keep things interesting, the typical response to inflation is higher interest rates. And herein lies the conundrum.
Recessions and bear markets can be caused by many things. One of the causes can be Federal Reserve action (or inaction). The importance of how the Fed responds to declining earnings in conjunction with sustained inflation, should the situation materialize, can not be overstated. It could have financial and political ramifications for years to come. We certainly do not predict this, but it bears watching.
 Commentary
Reason over Emotion
It is difficult to recognize investment opportunity in the moment. Without the benefit of hindsight, identifying opportunity when it presents itself requires clarity of thought, sound judgement, and courage of conviction. Emotion is a distraction to be ignored. That bears repeating: emotion is a distraction to be ignored.
Few of us have the ability to completely force emotion aside as we make critical investment decisions. Afterall, the proper choice is not always the obvious one. We can’t see what is about to happen, only what has happened already. Recency colors our judgement. The market keeps going higher and I am going to miss out! Or, this market scares me and I can’t take it any more. Rarely are emotional decisions good ones.
Sound decisions must take into account the probability of a good outcome. Too often investors don’t weigh the probability of an outcome, focusing only on the size of the benefit if the good outcome materializes. They fail to appreciate the amount of risk they assume to potentially realize a desired reward. What is an acceptable amount of risk for a potential return?
If you use your life’s savings to purchase Powerball tickets and you win, was that a good decision? It was a lucky one, for sure, but as they say, luck isn’t a strategy. If taking risk is your thing, then do so in an appropriate manner. The likelihood of a positive outcome when purchasing Powerball tickets is minimal, so use only a minimal amount of money.
When it comes to investing in the stock market, the decision is less black and white, and much easier to allow emotion to influence what we do. But remember, emotion makes us want to do the wrong thing at the wrong time for the wrong reason. You must not listen to your emotion, and instead listen to reason.
It is a well-observed fact that stocks have an upward bias over time. In other words, stocks go up more often than they go down. So we believe you should always be invested in equities, but not necessarily fully invested. But you needn’t always be ignorant of the level of risk in your portfolio. History has taught us that the greatest opportunities to put your capital to work in stocks is when prices are cheap. Yet time and again the greatest inflows into stocks are at or near highs in the market. Why? Emotion.
When stocks are cheap, people are scared. They fear stocks can get cheaper. And in fact they may. But even if they get cheaper, they still represent greater potential gain than when stocks are at all-time highs!
When stocks are at all-time highs, the likelihood of handsome returns in the future diminishes. There is a chart at the bottom of this page that helps illustrate this point. We show 10-year annualized returns for the S&P 500 for the last 80 years, and there is a clear pattern at play. The chart displays a well-defined series of peaks and troughs. The 1940s, 1970s, and 2000s all experienced negative 10-year returns. Each time the troughs are followed by accelerated rates of return, peaking (so far) somewhere in the mid-teens on an annualized basis. These peaks occurred in the 1950s, 1990s and at present. The first two peaks ended in decelerating rates of return, bottoming somewhere below zero. The present peak has yet to play itself out, though it is worth noting that it has not yet lasted nearly as long as the previous two.
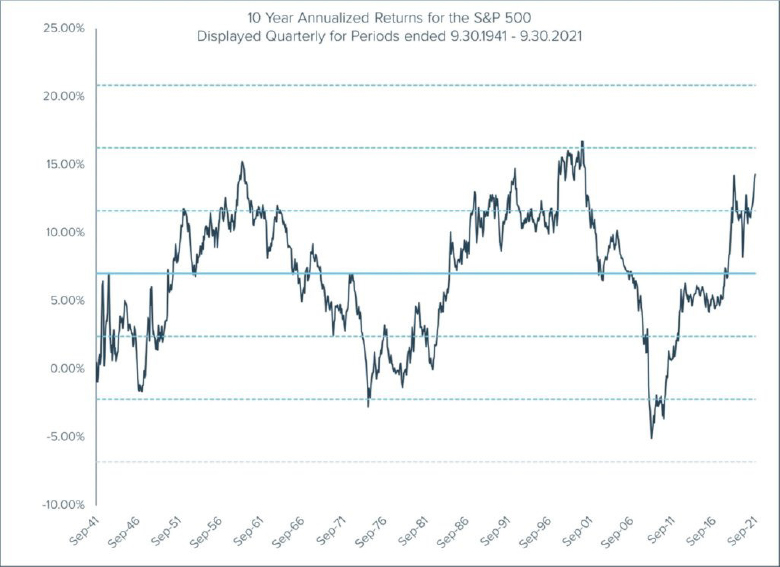
The pattern, however, is unmistakable. Without fail so far, 10-year returns always revert back to the mean. The mean, or average return, is represented by the heavy horizontal line going across the middle of the chart. Above and below the mean are fainter lines. These lines represent what statisticians know to be standard deviations. Within one standard deviation above and below the mean, 68% of all returns should reside. A full 95% of all returns should fall within the second set of bands, and 99.7% should fall within the third set.
Only three times in the last 80 years has the 10-year annualized return crossed beyond the second set of bands – once as a positive return and twice as a negative return. There have been 6 periods, 3 above and 3 below, when the 10-year return travelled past the first set of bands. The majority of the time the returns lie within the first set of bands.
What does this mean to us? This means that these outlier returns are likely unsustainable and they will ultimately revert back to more normal returns. And the further from the mean the travel, the greater the probability of a reversion sooner rather than later.
Stepping back to observe larger trends beyond recent experience is useful in terms of keeping emotion in check. We may feel the market will behave a certain way, and we may even be correct for a time. But how long we can expect to be right can only be considered with more perspective than the present. Observing the behavior of the market over 10-year windows helps put things into better perspective.
To that end, there is a chart on this page that contains data going back to 1880. Some may consider this no longer relevant, and perhaps this is so. Nonetheless, history may not repeat itself, but it certainly rhymes. Accordingly, we believe the data in this chart is worth noting.
You may be aware of a PE ratio as a measure of valuation. It is simply Price ÷ Earnings. A lesser-known valuation measure is the Cyclically Adjusted PE ratio, or CAPE. To smooth the cyclicality of corporate earnings, the CAPE ratio uses Price divided by the 10-year average earnings for stocks. The accompanying chart illustrates peaks and troughs similar to the preceding earnings chart. It also clearly indicates that stock valuations have only exceeded their present level once since 1880.
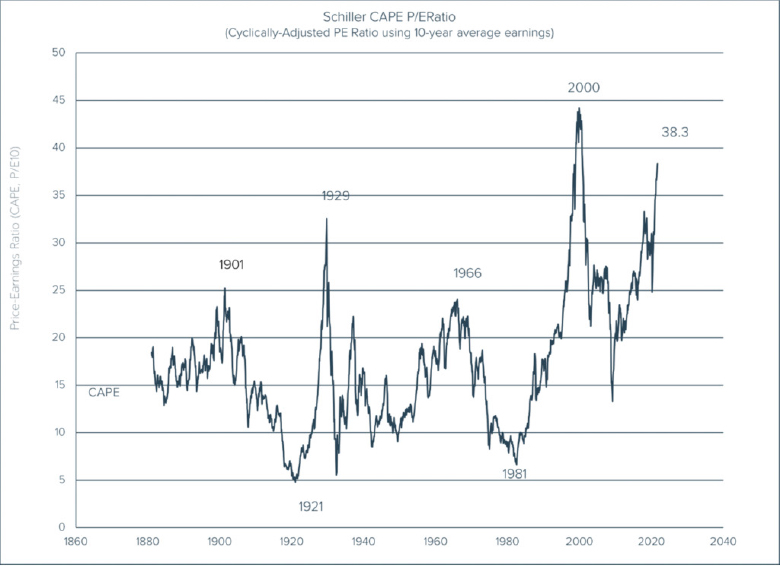
The two metrics used to observe risk in this article, 10-year annualized earnings and the CAPE Ratio, clearly point to the increased probability of diminished returns for stocks in the future. Others will point to different valuation metrics that make stocks seem attractive. Both can be right in the short run. But what should not be easily dismissed is the level of risk present in the market today.
So we have come to the radical conclusion that there is risk in the market. Now let us discuss how to manage that risk. First, be invested. Just because returns will likely be lower in the future does not mean they are in danger of being negative for any sustained period of time. Don’t expect a market decline, but don’t be caught out of position when there is one. Be poised to take advantage of it.
Tandem Investment Advisors serves as the sub-advisor to the Castle Tandem Fund (TANDX). The Fund is the mutual fund equivalent of the Tandem Large Cap Core strategy, which we have managed since 1991. We do not invest in “the Market”, and we do not invest simply for the sake of being invested. Rather, we invest in businesses that meet our criteria, at prices we think are reasonable.
When we own a business that has exhibited a valuation likely too high to be sustained, we consider it probable that valuation will ultimately return to its mean (think of the chart of 10-year returns). We are not eliminating a company simply because it appears to be expensive, but we will reduce our exposure to it, thereby reducing our risk. Similarly, when we own a business that appears unsustainably inexpensive, we will likely add to what we own, expecting its valuation to increase as it returns to its mean. By scaling back, but not getting out, at higher valuations, we have the ability to add back at lower valuations. In other words, we attempt to buy low and sell high. This is unemotional behavior that makes it possible to manage the risk in the Fund without trying to predict “the Market”.
Managing risk begins with being aware that it exists. The presence of risk is not a bad thing. With risk comes the potential for reward. It is, however, important to be certain that the potential reward justifies the level of risk you assume. A market near all-time highs may in fact provide reward to the investor. A market considerably cheaper has a greater probability of providing reward.
The best opportunities to invest are almost always the scariest ones as well. Be aware, be patient, be willing to hold some cash, and measure your risk. Leave emotion to someone else.
The opinions expressed are those of the Fund’s Sub-Adviser and are not a recommendation for the purchase or sale of any security.
The Standard & Poors 500 Index (S&P 500) is an index of 500 stocks.
The Fund’s investment objectives, risks, charges and expenses must be considered carefully before investing. The prospectus contains this and other important information about the Fund, and it may be obtained by calling 1-877-743-7820 or visiting www.castleim.com. Read it carefully before investing. Distributed by Rafferty Capital Markets, LLC Garden City, NY 11530.
Important Risk Information
The risks associated with the Fund are detailed in the Fund’s Prospectus. Investments in the Fund are subject to common stock risk, sector risk, and investment management risk. The Fund’s focus on large-capitalization companies subjects the Fund to the risks that larger companies may not be able to attain the high growth rates of smaller companies. Because the Fund may invest in companies of any size, its share price could be more volatile than a fund that invests only in large-capitalization companies. Fund holdings and asset allocations are subject to change and are not recommendations to buy or sell any security.
Comments are closed.