Financial Markets Review
The broader U.S. equity and fixed income markets have managed to tread water since mid-April. Over the past six weeks ended May 31, 2021, the S&P 500 has advanced 0.45%, while U.S. Treasuries, ranging from 2-year to 30-year maturities, have barely moved. Now that Q1 earnings season is largely behind us and additional fiscal stimulus talks have seemingly stalled, financial markets are able to take a much-needed breather.
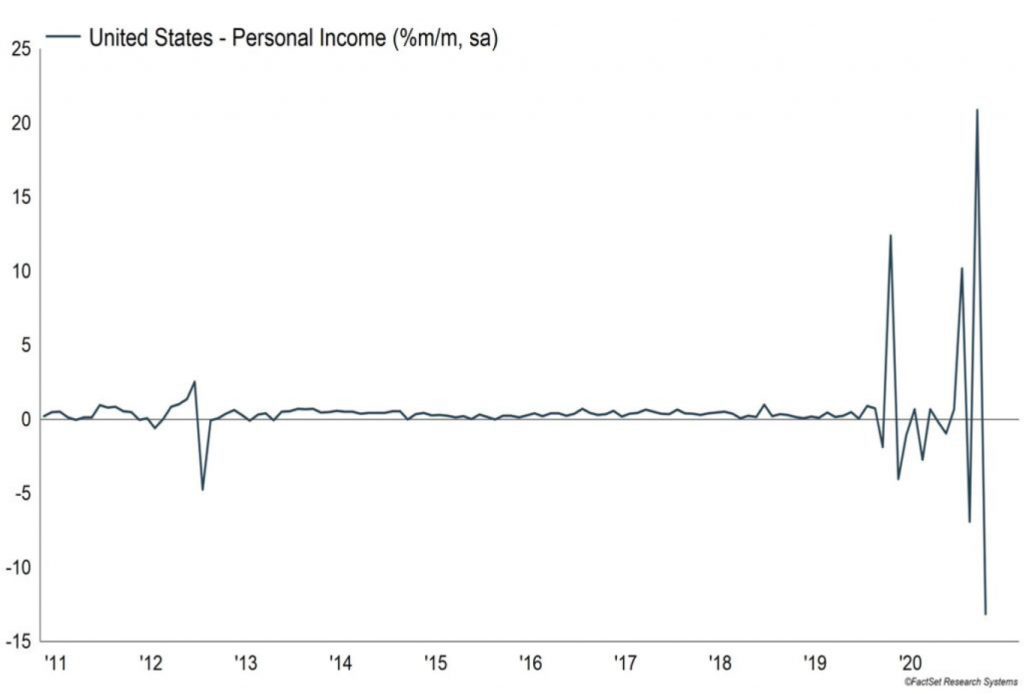
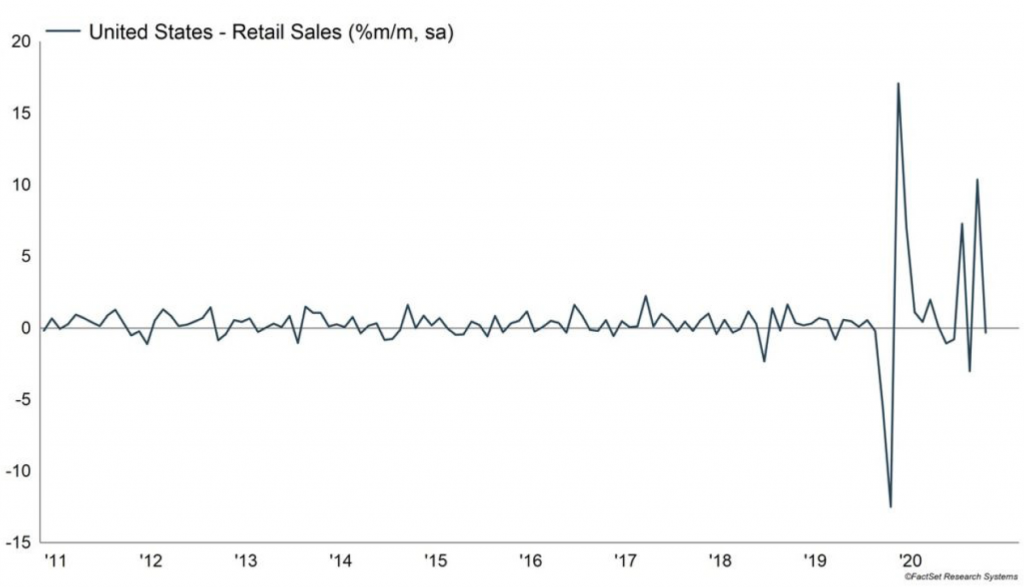
After a 90+% rebound in the S&P 500 off the March 2020 lows, and with much of the country opening back up, a pause that refreshes is probably the most desirable outcome for markets right now. Everything has moved so fast and been so volatile over the past 15 months, that it has been difficult to get a sense of what is real and what is sustainable. For instance, the month-over-month percentage changes in much of the consumption and personal income data continue to be so volatile that getting an accurate read on the consumer is futile. The charts below of Personal Income and Retail Sales put the volatile nature of the data into perspective when compared to the previous 10 years.


Meanwhile, the U.S. Dollar Index has declined roughly 2% and the Bloomberg Commodity Index has risen over 7% since mid-April, which has kept inflation on the forefront of everyone’s mind. The most recent inflation readings show year-over-year increases of 4.2% in the Consumer Price Index (“CPI”), 6.1% in Produce Price Index (“PPI”) and 3.6% in Personal Consumption Expenditures (“PCE”) and have done very little to cool current inflation worries. In fact, as nominal Treasury yields have stabilized, real yields across the entire curve have continued trending deeper into negative territory. In a nutshell, negative real rates are a sign that inflation expectations are outweighing those of growth expectations. The fixed income market is not anticipating a new era of growth, but more than likely an economy that climbs back to where it was pre-pandemic or possibly something closer to a stagflationary environment. However, it should be noted that the Federal Reserve owns 34% of the entire U.S. Treasury and Federal Agency market, so to say that interest rates are probably not a true gauge of market conditions would be an understatement. Therefore, gauging economic conditions based on interest rates is equally as futile as trying to figure out the consumer.
So where does that leave us? It is evident that building a portfolio from the top-down seems increasingly difficult these days. The rotation from value to growth and small-cap to large-cap change not only on a daily basis, but you can see it happen intra-day. Rather than spending a significant amount of time trying to figure out what side of the “style box” to over-and underweight, there is something to be said for owning a portfolio of individual businesses that can consistently grow through any economic cycle. Do not get me wrong, the macro backdrop will certainly affect the fundamentals of all businesses in one way or another. Depending on the environment, growth will accelerate or decelerate, and margins might expand or contract. That said, ownership of well-run companies whose products and/or services are in demand and are less dependent on the economic environment can afford you the ability to not have to throw darts at the “style box”.
Dividend Growth
When it comes to a company paying a dividend, the yield should play second fiddle to the growth of the dividend. And it is even more important to make sure the company can justify their dividend growth through actual fundamental growth of the underlying business.
For years we would field questions as to why we did not own AT&T (T), considering the company was part of an exclusive group called the “Dividend Aristocrats”. To be a part of this “club”, a company must increase its dividend every year for 25 consecutive years. AT&T consistently met this criteria for 35 years until just recently. In December of 2020, AT&T made the decision to not raise their quarterly dividend and kept it unchanged from the prior four quarters. In mid May, the company took it one step further and announced a roughly 50% cut in its dividend when they also announced a spin-off of their media segment. And just like that, the Aristocrat status was a thing of the past.
In full disclosure, our reason for not owning AT&T was not because we somehow knew that AT&T would slash its dividend one day. We never owned AT&T because its dividend growth never seemed to be justified by fundamental business growth. Over the past 10 years, AT&T increased its dividend per share by an annualized 1.9%. At the same time, revenue, EBITDA (earnings before interest, taxes, depreciation and amortization), and operating cash flow increased by an annualized 2-3%. Net income fared much worse, ending last year lower than it was 10 years ago. One might see the 2% cash flow and EBITDA growth and make the point that even though growth is meager, the 1.9% dividend growth is still justified by its fundamentals. However, as Lee Corso so animatedly says:

Since 2010, AT&T has made $93 billion in net acquisitions, while their long-term debt has swelled by 111% to $117 billion. So, for $93 billion and an extra $117 billion in debt, AT&T was able to gain an additional $45 billion in revenues, $15 billion in EBITDA, and $8 billion in cash flow. It does not take a significant amount of analysis to quickly see that AT&T’s underlying business is not growing and/or their $93 billion in acquisitions has not panned out as expected. Because the dividend growth was not justified by sustainable underlying fundamental growth, the company never met our criteria to be considered a holding.
I bring up the AT&T example for two reasons. As I mentioned before, we are at a point in this recovery where the economic data is still extremely volatile and Fed intervention within the fixed income market makes it extremely difficult to forecast where we are and, more importantly, where we are going in this economic cycle. Depending on the day, we are either entering reflation, inflation or even stagflation. At the very least, deflation seems to have been taken off the table for the time being. Regardless, I think it is safe to say that consensus is most concerned with an inflationary market environment. Therefore, if we are headed toward a period of sustained inflation, the last thing someone wants, assuming they value the income generated from their investments, is for that income to be fixed. At the very least, you want your income to grow at the rate of inflation to maintain purchasing power. And ideally, you would invest in a company that grows their dividend at a faster clip than inflation, leading to a positive real return, which is something you cannot get in the Treasury market these days.
The second reason I bring up AT&T is to point out that dividend growth justified by sustainable fundamental business growth is still an important long-term factor in the direction of the asset’s price.
As a point of reference, over the five years ended March 31, 2021, AT&T increased earnings and dividends a cumulative 18.22% and 9.47%, respectively, while the stock price declined by approximately 22%. AT&T’s “growth” was attributable to massive acquisitions and even then, it still lagged that of the S&P 500. Based on the stock price performance and recent decision to slash the dividend, it is very apparent that consistent and sustainable fundamental growth still matters!

The opinions expressed are those of the Fund’s Sub-Adviser and are not a recommendation for the purchase or sale of any security.
The Castle Tandem Fund does not hold a position in ATT&T Inc. The Standard & Poors 500 Index (S&P 500) is an index of 500 stocks. The U.S. dollar index (USDX) is a measure of the value of the U.S. dollar relative to the value of a basket of currencies of the majority of the U.S.’s most significant trading partners. The Bloomberg Commodity Index is a broadly diversified commodity price index that tracks prices of future contracts of physical commodities. The Consumer Price Index (CPI) is a measure that examines the weighted average of prices of a basket of consumer goods and services, such as transportation, food, and medical care. The producer price index (PPI), published by the Bureau of Labor Statistics (BLS), is a group of indexes that calculates and represents the average movement in selling prices from domestic production over time. Personal consumption expenditures (PCE) refers to a measure of imputed household expenditures defined for a period of time. Personal income, PCEs, and the PCE Price Index reading are released monthly in the Bureau of Economic Analysis (BEA) Personal Income and Outlays report. The S&P 500 Dividend Aristocrats Index is a list of companies in the S&P 500 with a track record of increasing dividends for at least 25 consecutive years.
The Fund’s investment objectives, risks, charges and expenses must be considered carefully before investing. The prospectus contains this and other important information about the Fund, and it may be obtained by calling 1-877-743-7820 or visiting www.castleim.com. Read it carefully before investing. Distributed by Rafferty Capital Markets, LLC Garden City, NY 11530.
Important Risk Information
The risks associated with the Fund are detailed in the Fund’s Prospectus. Investments in the Fund are subject to common stock risk, sector risk, and investment management risk. The Fund’s focus on large-capitalization companies subjects the Fund to the risks that larger companies may not be able to attain the high growth rates of smaller companies. Because the Fund may invest in companies of any size, its share price could be more volatile than a fund that invests only in large-capitalization companies. Fund holdings and asset allocations are subject to change and are not recommendations to buy or sell any security.


Comments are closed.