

TANDX::Institutional Shares
![]()
Risicare
What is risk? It’s subjective, really, isn’t it? An “in the eye of the beholder” sort of thing.
Perhaps Justice Potter Stewart’s opinion on obscenity best describes our understanding of risk – “I know it when I see it.” But do we?
To most, risk is only vaguely quantifiable. It is either present in some degree, or it isn’t. Others think of risk in terms of a probability or likelihood – I know I shouldn’t move this heavy piece of glass by myself, but I can probably manage.
Peter L. Bernstein wrote the definitive book on risk, titled Against the Gods: The Remarkable Story of Risk. The book is a bit academic for most, but important nonetheless. In it, Bernstein says of risk, “The word ‘risk’ derives from the early Italian risicare, which means ‘to dare’. In this sense, risk is a choice rather than a fate. The actions we dare to take, which depend on how free we are to make choices, are what the story of risk is all about.”
Most of us probably think about risk like we think of a traffic signal. Risk increases from none to some to a lot as we move up the light sequence from green to yellow to red. We make decisions nearly every day like this. Not that we all picture a traffic light when we are weighing risk vs. reward, but we are attempting to measure likely outcomes from our decisions. This is part of what makes us human. And by and large, we are pretty good at it.
Unless we are talking about investing. Then it seems as often as not that individualistic determinations of risk vs. reward give way to group think and trend following. It is reminiscent of the child’s defensive plea – everyone else did it! And to an extent, this lack of risk awareness for investors is understandable. Information is often incomplete or even conflicting.
Yet whether we perceive it or not, investment risk in some measure is always present. And even when we do perceive risk’s presence, we are not all together clear about how our behavior should be tempered for the risk we perceive.
From our perspective, risk provides opportunity, but not in the manner most might think. High and rising prices are good for those that already hold stocks, but less good for those wanting to buy them. Yet data suggests that more money flows into the market when prices are high than when prices are lower. How can this be if the aim is to buy low?
The answer is simply that when we are uncertain, we take comfort in numbers. If everyone is doing it, why shouldn’t we? High prices often beget higher prices, so why not get on board? We perceive there to be less risk when others behave as we do. Higher prices equal less risk because everything is working.
Similarly, when prices are falling we get nervous. We see prices going down and others selling, so we sell too. After all, with prices falling, risk is rising, isn’t it?
Not really. It certainly may feel that way emotionally, but in point of fact, risk and price generally move together. As prices rise, so too does risk. And as prices fall, risk declines.
Think about the traffic light again, as the chart below attempts to illustrate. Using the Case-Shiller PE as a proxy, we have charted the market’s valuation for the last 60 years. The Case-Shiller PE tracks the average PE over the preceding 10 years, thereby offering a smoother valuation tool than just the PE in the moment. It is more representative of trends. We have then overlaid the price of the S&P 500 in faint gray and separated the chart into 3 sections, green, yellow and red.
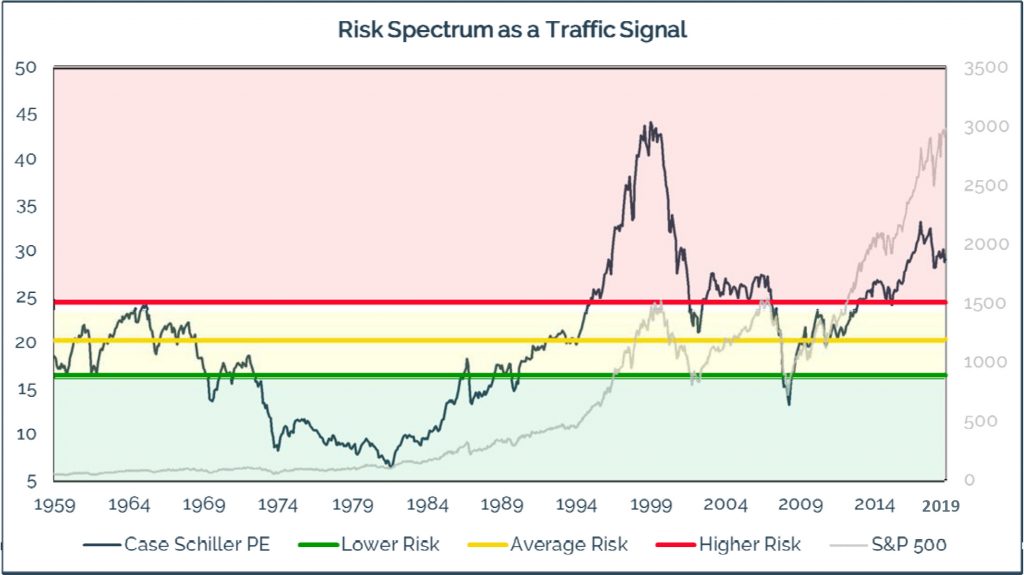
Like a traffic signal, green is at the bottom. It means go, the coast is clear and you may proceed. But it doesn’t mean you should abandon all caution. There may be something entering the intersection that doesn’t belong there, so move forward but pay attention.
Yellow is a warning that means pay attention and reduce your speed. Circumstances could be changing. In other words, risk’s presence is becoming a little more obvious. Don’t stop, don’t undo anything, but be prepared. Have a plan while you continue to proceed.
Red is where the traffic signal analogy becomes less perfect. On the roadway, failure to stop for a red light could result in an expensive ticket, or worse. In the investing world, the red light should not be taken as a hard stop. Do not sell everything and go hide. The world will most likely not end this time. And if it did, well, we would have bigger problems.
To us, red means risks have elevated as prices have risen, and there is opportunity in this elevated risk. Again, if the objective is to buy low and sell high, and if we bought when the light was green and yellow, red allows us to take advantage and sell high. This can reduce our risk by reducing our exposure to those investments that have become overvalued. Overvalued securities are typically the ones most susceptible to price declines. Reducing our exposure to them can reduce the impact of a down market.
It isn’t holding cash that reduces risk. It is reducing risky assets in our portfolio that reduces risk. And so the red light, like the green, is an opportunity not to be feared. Buy low, and sell high, and have the discipline and patience in between to wait.
The discipline to wait is important, because price matters. Investing just to be invested isn’t a strategy. It is a hope. Investing when the price is right is a strategy. It is not about timing the market. It is about appropriately recognizing the presence and amount of risk, and then acting accordingly. We must weigh risk vs. reward.
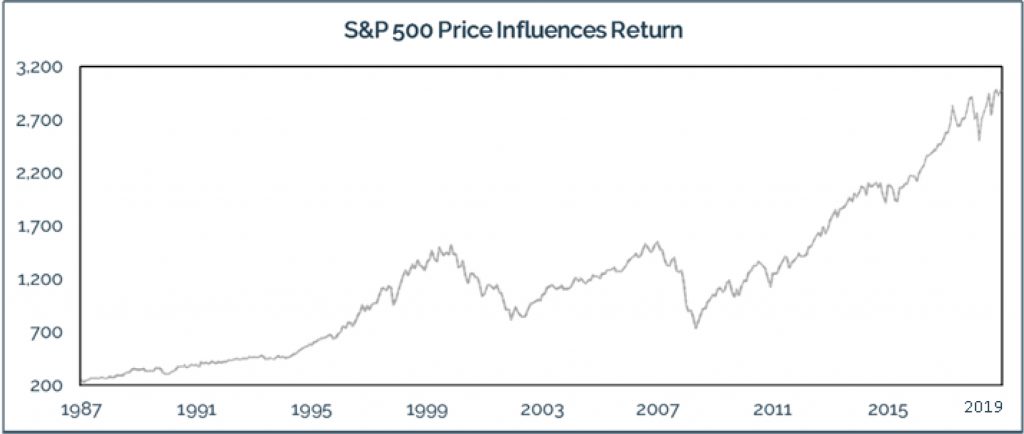
| Returns through 9/2019 | S&P 500 Price Influences Return | ||||||||
| Period Begins | 11/1987 | 3/1994 | 8/2000 | 9/2002 | 3/2005 | 10/2007 | 2/2009 | 7/2014 | 9/2019 |
| S&P Price | 230.30 | 445.77 | 1,517.68 | 815.28 | 1,180.59 | 1,549.38 | 735.09 | 1,930.67 | 2,976.74 |
| Annualized Return | 8.37% | 7.73% | 3.59% | 7.92% | 6.59% | 5.63% | 14.13% | 8.74% | NA |
Price matters. The table above illustrates this perfectly. The market was at or near a bottom in 1987, 2002 and 2009. The return for the S&P is highest in the table when bought during those years. Unfortunately, most perceived the risk to be the greatest at those times because the market had fallen by 25%, 50% and 50% preceding each bottom. Yet hindsight indicates those times were less risky than when the market was higher. Risk creates opportunity. Be aware of it and take advantage.
The Market Meanders
The stock market has taken investors on a wild ride since the start of the fourth quarter in 2018. Despite the ups and the downs, and the bumps and the bruises, the stock market has basically stalled out for the last year. This past quarter was no different, as the S&P 500 meandered higher by 1.19%, with only a brief stumble in August.
As the market drifted higher this quarter, it seemed that investors were unclear of what to make of the investing environment. On one hand, the United States is experiencing near-record low unemployment. Rhetoric out of the White House seems ever-optimistic that we are nearing a trade deal with China. And, the Federal Reserve is once again attempting to stimulate our economy. On the other hand, the manufacturing portion of our economy appears to be headed for a slowdown and corporate earnings growth is contracting once more.
If one is feeling a sense of Deja Vu of late, it’s with good reason. The current market backdrop seems very similar to that of 2015/2016.
Fears over a slowdown in China sparked a selloff in August 2015 that served as an overhang for the global markets for the rest of the year. At the same time, the stock market entered an earnings recession as corporations experienced negative earnings growth for six straight quarters.
China is once more slowing down. However, the head wind this time is exacerbated by the man-made creation of a Trade War. Trade uncertainty is finding its way into the global economy.
As Newton’s Third Law rightly states: For every action, there is an equal and opposite reaction. So, while the Trade War with China and the battle over fair trade and intellectual property might be beneficial for the long-term health of our economy, it comes with a short-term cost: a slowdown in our manufacturing.
In fact, U.S. manufacturing has now contracted for the past two months – a feat that has not occurred since 2015/2016. The good news is that manufacturing is not what it once was in our country. As of 2018, manufacturing does not even account for 12% of the U.S. GDP. Once upon a time, a slowdown in manufacturing would have been a surefire sign of an imminent recession. As we saw in 2015/2016 though, that is no longer the case. Our economy is now squarely in the hands of the consumer.
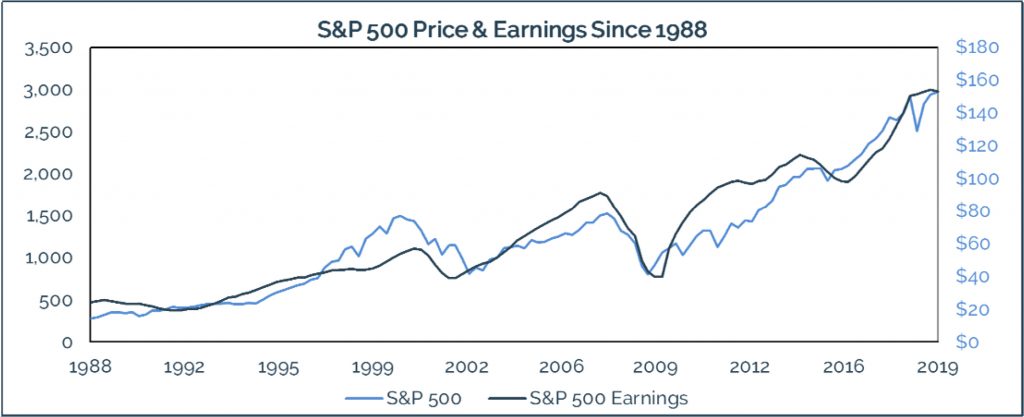
Perhaps most troubling though is that earnings are set to contract for the third straight quarter. In the short-term, headlines may drive price day to day. But over the long-term, fundamentals will continue to drive the market.
The fear of a prolonged corporate slowdown is evident in both interest rates and Federal Reserve rhetoric. The yield curve may have already signaled recessionary fears as it fell further into inverted territory throughout August before promptly reverting back to normal. Inversion of the 10-year U.S. Treasury note and the 3-month U.S. Treasury bill has preceded each of the last 7 recessions. The 10-year Treasury note has also slid precipitously from its 3.23% yield in October of 2018 to its current yield of 1.75%. A drop in interest rates can sometimes indicate a negative view on future growth. So, the bond market could be signaling that future growth prospects are somewhat limited. However, the Federal Reserve continued to get out from behind the 8-ball this past quarter as they cut the Federal Funds Rate twice and even announced additional stimulus just this month.
From our perspective, the current uncertainty in the marketplace creates opportunity. While the S&P 500 has been stagnant over the past 12 months, it is merely an index that reflects the weighted average performance of the top 500 companies listed on U.S. exchanges. At Tandem, we are not the market. We do not buy the market, nor do we particularly behave like the market. As such, a market idled by a dearth of earnings growth at large leaves many investors scrambling into names exhibiting any sort of earnings growth.
Over the long term, market volatility, trade wars, impeachment inquiries, and even presidential elections can be largely ignored. If a company is able to grow its earnings through any sort of economic environment, then over the long-term their price should also increase. Elsewise, the company will become cheaper and cheaper as earnings continue to grow. Over time, companies that can grow their earnings should also go higher in price.
The opinions expressed are those of the Fund’s Sub-Adviser and are not a recommendation for the purchase or sale of any security.
The Fund’s investment objectives, risks, charges and expenses must be considered carefully before investing. The prospectus contains this and other important information about the Fund, and it may be obtained by calling 1-877- 743- 7820, or visiting www.castleim.com. Read it carefully before investing. Distributed by Rafferty Capital Markets, LLC Garden City, NY 11530.
The risks associated with the Fund are detailed in the Fund’s Prospectus. Investments in the Fund are subject to common stock risk, sector risk, and investment management risk. The Fund’s focus on large-capitalization companies subjects the Fund to the risks that larger companies may not be able to attain the high growth rates of smaller companies. Because the Fund may invest in companies of any size, its share price could be more volatile than a fund that invests only in large-capitalization companies. Fund holdings and asset allocations are subject to change and are not recommendations to buy or sell any security.
Comments are closed.