

TANDX::Institutional Shares
![]()
Castle Tandem Fund Update
We invest in companies that we believe are capable of growing earnings regardless of economic circumstances. Why? Simply because we think these companies are more likely to reward patient shareholders. These types of companies are rare. A portfolio of these types of companies can exhibit lower volatility, reduce emotions and keep investors invested.
At this point I’m sure I sound like a broken record, but I think it bears repeating often – the investment approach we use when managing the Castle Tandem Fund is not the “market”. In no way does it reflect the broad equity market nor is the Fund managed in a way to replicate the stock market. At Tandem, we embrace tracking error. As a shareholder in the Castle Tandem Fund you don’t own the “market”, but instead you own a portfolio of 30 to 45 dividend-growing businesses. As a Fund shareholder, we think you should view yourselves as business owners and not owners of the Dow Jones Industrial Average (DJIA) or S&P 500. This is an important point to hammer home, since sometimes it can be forgotten when the nightly news starts every segment with the DJIA rising or falling by 500 points on any given day.
For the most part, the Fund’s core holdings have held up quite well amidst the volatility. Fundamentally, the businesses we’ve invested in have continued to grow through the most recent corporate earnings slowdown. With nearly all companies having reported second quarter earnings, our core holdings posted 12.21% and 13.15% sales and earnings growth, respectively. This compares favorably to the S&P 500’s sales growth of 4.01% and a -0.36% decline in earnings. Looking forward to the third quarter, the S&P 500 is expected to continue decelerating with 2.86% sales growth and a further decline of -3.63% in earnings. Likewise, our businesses are expected to grow sales and earnings at 12.65% and 8.22%, respectively.
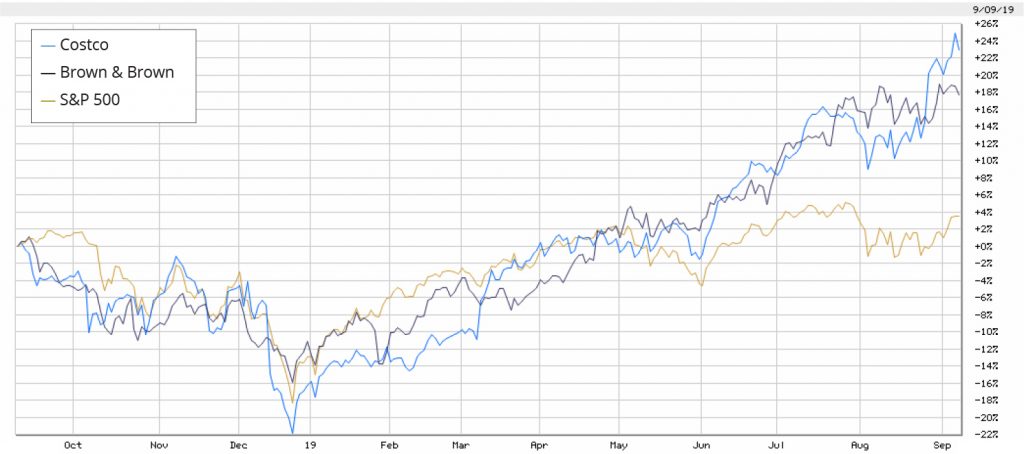
Since our last update, we have continued to trim our positions in a few of the Fund’s holdings – Brown & Brown (BRO) and Costco (COST). Both companies have exhibited exceptionally strong fundamental growth over the past several years to the point that investors have bid up their valuations to very lofty levels. However, as of recently, this growth has begun to decelerate, which has triggered our quantitative model to assign them a sell ranking and so we sold approximately 25% of each position.
The most recent spate of volatility has provided opportunities in certain stocks, but unfortunately these companies do not pass through our quantitative model and therefore are not worth owning. As of now, we continue to see more stocks that meet all our quantitative and qualitative criteria being ranked overvalued, which has not been conducive to us putting cash to work in new businesses or adding to existing holdings. Until then, we will remain patient and ready to deploy the Fund’s cash when those opportunities are presented to us.
Financial Markets Review
“It is a tale told by an idiot, full of sound and fury, signifying nothing.”
William Shakespeare, Macbeth (Act V, Scene V)
I’m not sure I could’ve come up with a better way to sum up the stock market’s price action over the past four weeks. And honestly, it has been going on a whole lot longer. The past four weeks have just been a microcosm of the past 19 months. Indecision and confusion have paralyzed the S&P 500 for quite some time. It’s been a wild and volatile ride, but in the end, the U.S. equity market has essentially gone nowhere.
The same cannot be said for the fixed income market. Bonds are signifying something. And what that something is, is up for debate. If you or your clients were not familiar with the “yield curve inversion” before August, you are probably now well enough versed to have a meaningful conversation at your next cocktail party. The media certainly did a bang-up job covering this topic, to the point of possibly scaring everyone into a recession. The 10-year Treasury bond yield finally traded below the 2-year Treasury note yield in August for the first time since before the Great Recession. We’ve highlighted the narrowing of this spread for years, so none of this should’ve come as much of a surprise. In fact, the 2-year to 10-year has been the last notable part of the curve to invert. As we’ve pointed out for months now, the short end of the curve has been inverted since the beginning of the year. Now, nearly the entire yield curve is inverted with the 30-day Treasury bill trading with a higher yield than the 30-year Treasury bond. The current setup in Treasury yields is indeed a warning to heed.
The real conundrum is why yields are acting the way they are. Historically, yields on the long end of the curve have reflected the prospects of future economic growth. Considering the 30-year U.S. Treasury bond was trading at 3.46% only 10 months ago and it has recently traded as low as 1.90%, one might infer that the economy could be headed for a significant slowdown. Couple this with the time-tested recession indicator of an inverted yield curve and there is reason to worry that a slowdown or recession is very much in the cards.
Unfortunately, we live in unprecedented times with unfettered central bank intervention and negative interest rates becoming the norm throughout the world. The current total of negative yielding debt around the world has topped $17 trillion with 30% of all investment-grade bonds now trading with a negative yield. With much of the world either in a recession or knocking at its door, the prospect of yields plunging further into negative territory is very high. Global central banks have begun easing in unison, which has caused many to question whether the U.S. is next in line for NIRP (Negative Interest Rate Policy). Since the U.S. is one of the last places in the world where its debt trades with a positive yield and has a stable to appreciating currency, fixed income investors are lining up in droves to own this paper. The immense demand for a positive yield is certainly another reason why U.S. yields have dropped as swiftly as they have. If you are a major insurance company or pension plan with long duration liabilities and your belief is that negative interest rates will be more prominent in the future, you would be crazy not to buy as many 30-year U.S. Treasury bonds at current yields as possible.
The problem with either scenario – slowing economic growth or the path to NIRP – is that neither instill a whole lot of confidence in markets going forward. If there was one scenario to wish for, as crazy as it might sound, it would most definitely be an economic slowdown. There are plenty of signs of this already occurring that can be seen in housing permits and starts, the manufacturing sector, job growth and corporate profits. An economic slowdown or even a shallow recession is a normal part of the business cycle and should not be feared, especially after the longest economic recovery on record.
What should absolutely be feared is the adoption of NIRP. Negative interest rates destroy capital, investment, savings and the concept of risk. Economies grow and prosper around a functioning financial and banking system. The entire business model of a bank is put into question if they lose money on every loan they make. When banks stop lending, investment stops, which leads to contraction and the ultimate failure of an economy. The European Central Bank (“ECB”) was the first major central bank to institute NIRP in June 2014. Since that time, the iShares MSCI Europe Financials ETF (EUFN), which is made up of mostly european bank and insurance companies, has declined more than 30%. The largest European economy and fourth largest in the world – Germany – is one negative GDP print away from a technical recession. And, their entire yield curve is trading at negative yields. Negative yields are not stimulative; they are destructive.
Billy Little, CFA
The opinions expressed are those of the Fund’s Sub-Adviser and are not a recommendation for the purchase or sale of any security.
As of June 30, 2019, Brown & Brown, Inc. (BRO) and Costco Wholesale Corp. (COST) represented 3.47% and 2.45%, respectively, of the Castle Tandem Fund’s total net assets. The iShares MSCI Europe Financials ETF (EUFN) is not a holding of the Fund.
The Standard & Poors 500 Index (S&P 500) is an index of 500 stocks. The Dow Jones Industrial Average (DJIA) is an index of 30 large public U.S.-based companies. Yield Curve Inversion refers to a situation in which long-term debt has a lower yield than short-term debt of the same credit quality. Bonds can effectively have a Negative Yield if the price of the bond in the secondary market is trading at a substantial premium.
The Fund’s investment objectives, risks, charges and expenses must be considered carefully before investing. The prospectus contains this and other important information about the Fund, and it may be obtained by calling 1-877- 743- 7820, or visiting www.castleim.com. Read it carefully before investing. Distributed by Rafferty Capital Markets, LLC Garden City, NY 11530.
The risks associated with the Fund are detailed in the Fund’s Prospectus. Investments in the Fund are subject to common stock risk, sector risk, and investment management risk. The Fund’s focus on large-capitalization companies subjects the Fund to the risks that larger companies may not be able to attain the high growth rates of smaller companies. Because the Fund may invest in companies of any size, its share price could be more volatile than a fund that invests only in large-capitalization companies. Fund holdings and asset allocations are subject to change and are not recommendations to buy or sell any security.
Comments are closed.