

Market Comments
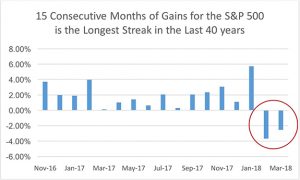
After a long absence, volatility returned to the equity market this past quarter. In our previous quarterly commentary “The Flip Side” we wrote “The S&P 500 closed 2017 with its 14th consecutive positive month. This is the longest monthly winning streak for the S&P 500 in the last 40 years.” That streak did extend to a fifteenth month in January 2018, although it did end in February of 2018.
To download a PDF of this report, click here.
“Let’s go hunt for snipe!” If that invitation means something to you, you’ve likely been tricked by someone or duped someone yourself… or both. For those not familiar with the snipe hunt, here’s how Wikipedia explains it:
A snipe hunt is a type of practical joke, in existence in North America as early as the 1840s, in which an unsuspecting newcomer is duped into trying to catch a non-existent animal called a snipe. While snipe are an actual family of birds, the snipe hunt is a quest for an imaginary creature whose description varies.
The target of the prank is led to an outdoor spot and given instructions for catching the snipe; these often include waiting in the dark and holding an empty bag or making noises to attract the prey. The others involved in the prank then leave the newcomer alone in the woods to discover the joke. As an American rite of passage, snipe hunting is often associated with summer camps and groups such as the Boy Scouts.
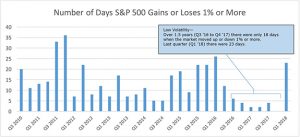
Volatility is a normal characteristic of the equity market but it had been notably ‘snipe-like’ over the past few years. If you look at the chart below you will see how rare volatility sightings were prior to this quarter. A few takeaways from the chart:
Over the year and a half ending December 31, 2017 there were only 18 ‘volatile’ days (days in which the S&P 500 moved up or down 1% or more).
In Q1 2018 volatility returned and we saw a total of 23 volatile days in the quarter.
In the last quarter of 2017 there were zero volatile days.
While we’ve been defensively-minded for some time, the recent lack of volatility in a long-lived bull market has given us further pause: are investors so accustomed to winning that they have forgotten what losing feels like?
We view volatility not as risk, but as opportunity – a favorable time to use cash to add to individual positions that we already own and have become more attractive or the opportunity to initiate new positions in company’s we have on our watch list. The return of volatility to the market in the first quarter gave us just that opportunity as you will in the section below. During the first quarter of 2018 we sold out of 2 positions and added 2 new positions to the Fund’s portfolio.
Portfolio Overview
Buys and Sells
During the first quarter of 2018 we added Anheuser-Busch InBev (BUD, 2.43% of Fund assets as of 3/31/18) and Howard Hughes Corp. (1.19% of Fund Assets). We sold our position in Jones Lang LaSalle, Inc. and VF Corp.
Cash
The Fund’s cash position (cash and cash equivalents) on March 31, 2018 was 33.19%, slightly lower than where we ended the prior quarter.
Risk and Volatility
For the five years ending March 31, 2018, the Fund’s beta was 0.50, half that of the S&P 500. For the same period, our standard deviation was 6.11% versus a S&P 500 standard deviation of 9.87%. Up Capture versus the S&P 500 for the five year period was 53.58% and down capture was 56.89%.
Regards,
![]()
Caeli Andrews
Managing Director
Castle Investment Management

Andrew Welle
Managing Director
Castle Investment Management
The opinions expressed are those of the Fund’s Adviser and are not a recommendation for the purchase or sale of any security.
The Standard & Poors 500 Index (S&P 500) is an index of 500 stocks. Beta is a measure of the Fund’s sensitivity to a benchmark or broad market index which has a beta of 1.00. Standard deviation is used to measure an investment’s historic volatility. The up capture and down capture ratios are statistical measures of a manager’s overall performance in upward moving and downward moving markets, respectively. We define a full-market cycle as a period of time, usually measured in years, that includes both ‘bearish’ markets (the market trends down) and ‘bullish’ markets (the market trends up).
The Fund’s investment objectives, risks, charges and expenses must be considered carefully before investing. The Prospectus contains this and other important information about the Fund, and it may be obtained by calling 1-877-743-7820, or visiting www.castleim.com. Read it carefully before investing.
The expense ratio excluding acquired fund expenses for the Investor Share Class is 1.34% (2.34% for Class C). The expense ratio including acquired fund expenses for the Investor Share Class is 1.41% (2.41% for Class C). Effective November 1, 2017 the Adviser has contractually agreed to waive Services Agreement fees by 0.24% of its average daily net assets through October 31, 2018. The Services Agreement fee waiver will automatically terminate on October 31, 2018 unless it is renewed by the Adviser. The Adviser may not terminate the fee waiver before October 31, 2018. The total expense ratio excluding the Services Agreement fee waiver for the Investor Share Class is 1.65% (2.65% for Class C).
The risks associated with the Fund, detailed in the Prospectus, include the risks of investing in small and medium sized companies and foreign securities which may result in additional risks such as the possibility of greater price volatility and reduced liquidity, different financial and accounting standards, fluctuations in currency exchange rates, and political, diplomatic and economic conditions as well as regulatory requirements in foreign countries. There also may be risks associated with the Fund’s investments in exchange traded funds, real estate investment trusts (“REITs”), significant investment in a specific sector, and nondiversification. Technology companies held in the Fund are subject to rapid industry changes and the risk of obsolescence. The Fund is non-diversified, meaning it may concentrate its assets in fewer individual holdings than a diversified fund. Therefore, the Fund is more exposed to individual stock volatility than a diversified fund.
Distributed by Rafferty Capital Markets, LLC-Garden City, NY 11530.
Comments are closed.