

Market Commentary
December 3, 2020
For years now, financial market participants and observers have opined on the unintended consequences of the unprecedented monetary policies undertaken by global Central Banks. Depending on the Central Bank, these policies have included everything from buying the bad debt on private sector banks’ balance sheets, monetizing fiscal deficits, buying corporate bonds, and even going so far as buying equity-based ETFs. There is only one thing left for them to buy…

In all seriousness, Central Banks around the world have expanded their balance sheets to mind-blowing levels with little to no perceived negative effects on financial markets. Many would argue that the policies of Central Banks have had great social consequences and have contributed immensely to the wealth and income gap we are experiencing today. I do not disagree, but that is a conversation for another day, as I want to keep the focus of this piece on the direct impact on financial markets. Within the realm of financial markets, we have seen virtually all financial assets – equities, bonds, and real estate – move higher in price over the past decade without the consensus expectation of hyperinflation, as measured by CPI. One might call this the goldilocks market or even a state of nirvana.
The Institute of International Finance (IIF) recently announced that global debt is on track to exceed $277 trillion by the end of 2020, which equates to 365% of global GDP. How does this compare historically? Looking back over the past 70 years, from 1950 to the early ‘80s, global debt to GDP hovered around 120%. When U.S. interest rates peaked in 1981 and subsequently began to fall, global debt started to outpace GDP growth and has since never looked back. Global debt to GDP grew to roughly 200% just before the Financial Crisis and it has nearly doubled again over the most recent decade. Eventually, you would think there would be a breaking point, but no one can predict when or even what that would look like, since we are in uncharted territory. Regarding any potential consequences, we are all learning, analyzing, and opining on the fly.
However, there is one very notable consequence that has reared its head as global leverage ratios have increased and Central Banks experiment further with drastic monetary policy actions – increased asset price volatility. Over the past several years, we have highlighted on many occasions the changing volatility landscape and the use of leverage within all financial markets – currencies, fixed income, equities, and commodities. Leverage has been a tactic used by nations, corporations , and individuals since the beginning of time, in order to use their current asset base to enhance growth . As with most things in life, when used responsibly, debt can be used to increase returns. However, once the underlying assets turn against you and move in the opposite direction of your desired outcome, the use of leverage will exacerbate your losses. In short, the use of debt and increased leverage ratios amplify volatility.
I have been writing this monthly column for six years and recently the one thing I have noticed is the frequency with which I write about historical occurrences in the financial markets and new records being set. So, I set out to review the past six years of columns to gauge the frequency of these occurrences and here are a few snippets of market extremes.
- February 2015 – Swiss National Bank unexpectedly lifts its cap on the Franc’s peg to the Euro. The Franc shot up 40% against the Euro before closing the day up nearly 20%. This marked a 20 standard deviation move, which to put into context, a 7 standard deviation move should only occur once every billion years.
- January 2016 – In the first week of trading, the S&P 500 declined 6%, which was the worst start to a year in the history of the stock market.
- June 2016 – After the United Kingdom votes to leave the European Union, the EU banking index fell 14.5% – the largest single day decline on record; Gold increased 5% – its biggest single day increase since the bankruptcy of Lehman Brothers ; the Spanish stock market crashed 12.3% – its largest decline since 1987; and the Pound declined 12% intra day relative to the U.S. Dollar – the largest intraday decline on record.
- All of 2017 – One month implied correlation of the companies in the S&P 500 hit an all-time low; first time ever that the S&P 500 Total Return Index was up every month of the year and at the time closed higher 21 of the previous 22 months; the lowest average daily VIX in any given calendar year.
- January 2018 – 310 days since the S&P 500 had registered back-to-back losses of at least 0.50%, which was the longest stretch on record.
- February 2018 – S&P 500 falls 12% over 8 trading days
- December 2018 – S&P 500’s worst December performance since the Great Depression in 1931; a record number of asset classes posted negative total returns in 2018.
- January 2019 – S&P 500 logged its best January since1987.
- April 2019 – VIX futures contracts recorded the largest short position on record.
- January 2020 – CNN Fear & Greed Index hits highest “extreme greed “ level on record.
- March 2020 – S&P 500 crashes 35% over 22 days, which marked the fastest drop of that magnitude on record.
- June 2020 – S&P 500 rises 38% over the course of 50 days, which was the largest 50-day rally on record.
- September 2020 – S&P 500 hits a record high, making it the second fastest recovery from a bear market low on record.
- November 2020 – Record inflows into global equities and multiple equity valuation metrics in the 100th historical percentile.
After reading through the above market events and some of the records that have been set, it is clear that volatility is higher, and the extremes are becoming more frequent. Most of the time, volatility is used in conjunction with falling asset prices. It is often said that prices will “take the escalator up and the elevator down.” However, the truth is that volatility works both ways – on the upside and the downside. Volatility does not always have to carry a negative connotation, but one of the negative consequences of volatility is increased emotion and, in turn, bad decision making.
The shift in investor sentiment between fear and exuberance has been truly epic and can clearly be seen in the following chart of the CNN Fear & Greed Index.
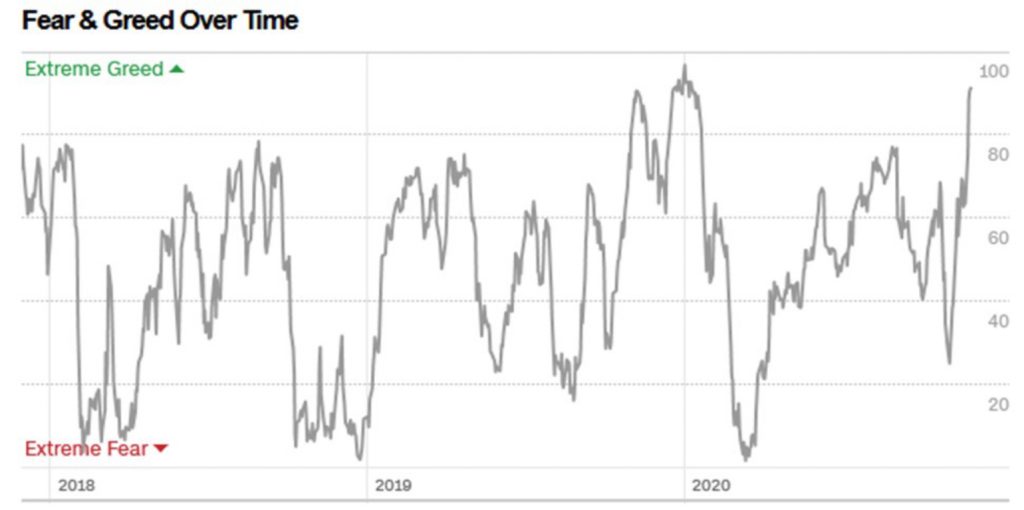
It is our belief that volatility and these unprecedented shifts in investor sentiment are not going away any time soon. Unless there is a global real economic growth renaissance, the mountain of debt and nose bleed leverage ratios will likely keep rising. What does this ultimately mean for you – the investor? Expect the unexpected and stick with an investment strategy that can control your emotions. Emotions get in the way of sound decision making, because in the moment, extreme fear is never more frightening and extreme greed is never more euphoric. As always, the truth lies somewhere in between. And finding the investment strategy that can keep your blood pressure from looking like the chart above is a good place to start.
Castle Tandem Fund Update
It has been a quiet couple of months regarding transaction activity within the Fund. As markets rallied after the election, so did many of our core holdings. We will cover two Fund holdings in particular, both of which we have owned in client accounts for many years prior to the launch of the Castle Tandem Fund.
A couple of weeks ago, our quantitative model gave us the valuation signal to trim the Fund’s position in Brown Forman (BF.B). Brown Forman has been a staple in our strategies for over 13 years. It was added to the Fund’s portfolio shortly after launch in March 2019. You will likely find many of their products on your wet bar or favorite watering hole.
Lastly, we recently finished liquidating another long time holding – Signature Bank (SBNY). Again, much like BF.B, we’ve owned SBNY in our strategies for some time (since 2011), and it was also a holding added to the Fund shortly after its launch. Part of our sell discipline is to review any company that has significantly underperformed the broader market and its industry on a relative basis. Ultimately, we want to make sure the business is still the same as what we originally purchased and that there is not a non-quantifiable risk present.
When we first purchased SBNY in client accounts, they were a relatively small bank with a unique business model. They set out to create a bank with a single point of contact approach geared toward serving businesses, business owners and executives. SBNY experienced significant growth and did very well; however, they never quite diversified their assets to avoid being geographically concentrated in New York City. Outside of adding banking teams in other cities, SBNY has turned to the cryptocurrency industry to grow their business, which is quite the change from the small “community” bank we bought nearly 10 years ago. Building out block chain technology platforms and being the go-to bank for global cryptocurrency custodians is a far cry from loaning money to a developer trying to build an apartment building. Cryptocurrency is still in its infancy and who knows, this change in clientele might ultimately prove to be the right move. However, it is a significant change in the business that brings about risks we have trouble quantifying.
SBNY initiated a dividend in 2018. At the time of the dividend announcement, SBNY mentioned that they anticipated growing their dividend alongside their business. This past quarter marked the 8th quarter of paying the same dividend and management specifically said they do not foresee increasing their dividend in the future and if anything, they would prioritize share buybacks over a dividend increase. In conjunction with the non-quantifiable risks mentioned above and their recent dividend policy shift, SBNY no longer met our criteria to be held as a core holding.

The opinions expressed are those of the Fund’s Sub-Adviser and are not a recommendation for the purchase or sale of any security.
The Fund’s position in Brown Forman (BF.B) as of September 30, 2020 represented 1.72% of Fund assets. The Fund’s position in Signature Bank (SBNY) as of September 30, 2020 represented 3.09% of Fund assets.
The Standard & Poors 500 Index (S&P 500) is an index of 500 stocks. The VIX is a market index that measures the expectation of near-term volatility.
The Fund’s investment objectives, risks, charges and expenses must be considered carefully before investing. The prospectus contains this and other important information about the Fund, and it may be obtained by calling 1-877- 743- 7820 or visiting www.castleim.com. Read it carefully before investing. Distributed by Rafferty Capital Markets, LLC Garden City, NY 11530.
The risks associated with the Fund are detailed in the Fund’s Prospectus. Investments in the Fund are subject to common stock risk, sector risk, and investment management risk. The Fund’s focus on large-capitalization companies subjects the Fund to the risks that larger companies may not be able to attain the high growth rates of smaller companies. Because the Fund may invest in companies of any size, its share price could be more volatile than a fund that invests only in large-capitalization companies. Fund holdings and asset allocations are subject to change and are not recommendations to buy or sell any security.
Comments are closed.