

Financial Markets Review
September 8, 2020
Anyone interested in financial markets and more specifically, equity markets, would have found the week of August 17th to be fascinating. For starters, the S&P 500 Index reclaimed all of its COVID losses and set an all-time closing high of 3,389.78 on August 18th. Since the 1950s, the S&P 500 has fallen into bear market territory 10 times, which is typically defined as “a decline of greater than 20%.” Of the 10 bear markets, the average time from a 52-week high to the market’s bottom has been 15 months, and from the market’s bottom back to a new all-time high has been 28 months. This time around, it took 1 month for the S&P 500 to bottom after hitting an all- time high and 5 months to fully recover from the lows. To summarize, we just experienced the fastest bear market on record and the second fastest recovery.
The S&P 500’s recovery has a lot of people questioning the relationship between stocks and the economy. The questioning and skepticism regarding stocks is understandable considering an additional 1.0 million people just filed initial unemployment insurance claims, roughly 14.5 million people continue to receive unemployment insurance checks and the total unemployment rate remains above 10%.
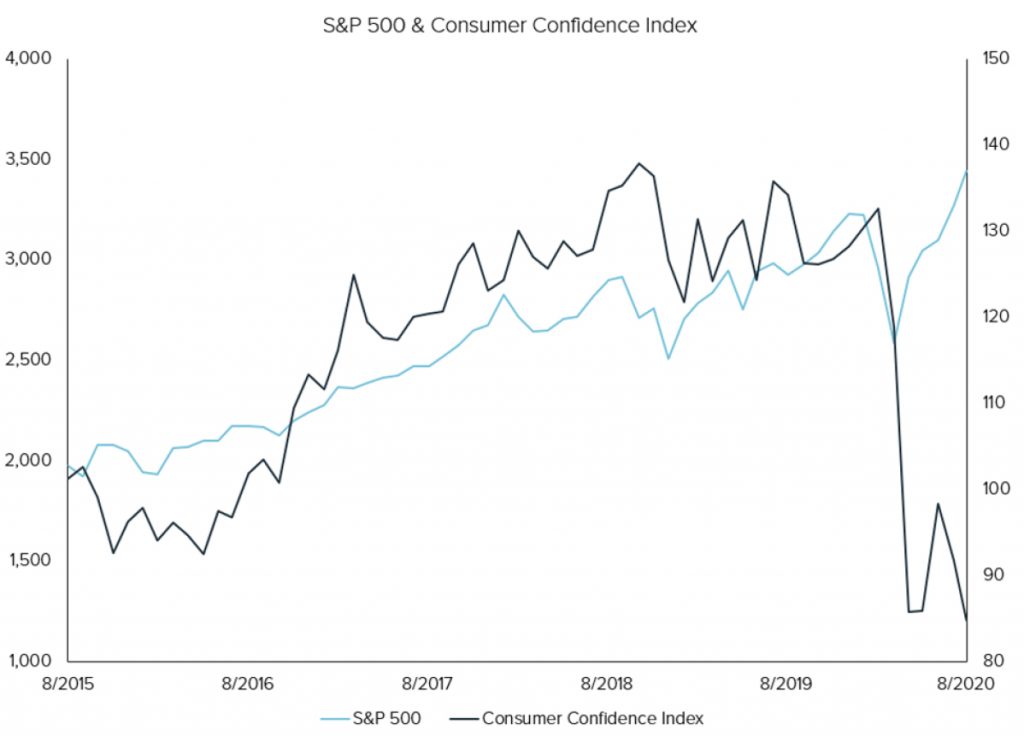
In fact, the following chart depicts the widening divergence between the economy and the stock market extremely well. It is a chart overlaying the Consumer Confidence Index and the S&P 500. Typically, there is a high correlation between the two data sets. Over the past few months and even more so in August, these lines have gone in opposite directions.
We have previously discussed the divergence between stocks and the economy and why stocks have done so well. Monetary and fiscal stimulus being pumped into the economy can be attributed to much of the rally. However, not all stocks are created equal. And what has been brewing for quite some time, the lack of market breadth or narrowness of the equity rally, has finally caught the attention of the financial media.
Wikipedia describes the S&P 500 as “one of the most commonly followed equity indices, and many consider it to be one of the best representations of the U.S. stock market.” Recently, financial pundits have debated whether the S&P 500 truly represents the broad U.S. stock market. If the trading action during the week of August 17th was of any indication, the answer is perhaps, no.
It is now well known that the “stock market” recovery has been driven by a handful of the largest companies – Apple (AAPL), Microsoft (MSFT), Amazon (AMZN), Facebook (FB) and Alphabet (GOOG & GOOGL). These 5 companies make up 23.5% of the S&P 500’s entire market value and are up on average 53% year-to-date. The other 495 companies that make up the remaining 76.5% of the S&P 500 are down on average 4% year-to-date. With the S&P 500 making record highs and now up 8% year-to- date, 70% of all companies included in the index are up less than 8% year-to date with 57% of all companies in the index still down on the year. In fact, only 41 of the companies in the S&P 500 are currently making 52-week and year-to-date highs. It is evident that most companies are not doing nearly as well as the S&P 500 might suggest, and the few keeping the index afloat are not representative of the economy.
As I mentioned in the beginning of this commentary, the week of August 17th was a fascinating week of trading for the sole reason that the price divergence between the S&P 500 and a majority of the underlying companies continued to grow, culminating in an epic final day of the week. The S&P 500 closed Tuesday and Friday at all-time highs. Throughout the rest of the week, the index traded in a tight range and never fell more than 1% from its high at any given point, ultimately rising 0.7% for the week. However, in every sector, more companies saw their share price fall than those that saw it rise. This trading condition has only happened 4 times since 1998. Typically, when declining stocks have outnumbered advancing stocks in every sector, the average S&P 500 weekly return has been a decline of more than 3%.
Friday August 21st capped off a week’s worth of terrible market breadth, the S&P 500 advanced 11.7 points, while Apple contributed 12.0 of those points. Put another way, on a day where the S&P 500 closed at a record high, one company – Apple – single handedly was responsible for the entire day’s advance.
There is very little that would be considered normal about the world we live in today. Who knows this might be the new normal? But in the moment, it is extremely difficult to draw comparisons to the past. Historically, this type of market breadth and narrow leadership preceded market declines. Reason being that once most stocks start to fall, it is only a matter of time before the few propping up the market fall too. However, at no time in history have the top 5 largest companies in the S&P 500 had the same amount of influence as the bottom 363 companies combined. We are in uncharted territory, and when you find yourself in uncharted territory, it is more important than ever to adhere to your discipline and acknowledge the risks around you. Some of these risks include the following:
- Valuations – According to Goldman Sachs, the median stock in the S&P 500, measured by forward P/E, is in the 100th percentile of historical levels. The forward P/E of the S&P 500, as a whole, is in the 98th percentile. Valuation is never the reason for a correction in stock prices, but as valuations become stretched, the risk of a correction rises.
- Permanent job losses – Recently there was an article in the Washington Post discussing temporary job losses or furloughs turning into permanent job losses. Their data showed roughly 33% of employees put on furlough in March were permanently laid off in July. Also, they mention that 4 million small businesses, which are not represented by a stock price in the S&P 500, are expected to close in 2020 with only 1.3 million new businesses being formed.
- Investor sentiment – There are several investor surveys and sentiment readings that are back to levels witnessed at previous market tops. The Investors Intelligence survey shows bullish sentiment outpacing bearish sentiment by nearly 4 to 1. The CNN Fear and Greed Index is back to “extreme greed”. The NAAIM equity exposure for active managers is back over 100. On the flip side, the AAII Investor Sentiment survey shows 30% bulls and 42% bears. However, this makes sense given that it is a survey of individuals and individuals are not experiencing the same recovery as an Apple, Amazon, or Microsoft.
All of these risks are likely not being appreciated or priced in by those who simply follow the “index”. It is a good time to know what it is that you own and be comfortable with your holdings when volatility rears its ugly head again.
One of the questions we often get after a significant run up in the market is about cash levels within the Fund. It is understandable and logical to question why we are not fully invested as the market creeps higher every day. We have been fielding calls and emails regarding cash levels over the past couple of weeks, therefore I figured it would be a good refresher to explain our stance on cash.
Our stance is this – we have no stance. Let me explain. Cash is a byproduct of our process; it is not an allocation decision. As an investment team, we might opine on what we think about financial markets or the economy, but by no means do we make investment decisions off those thoughts and conversations. Because if we did, it would inherently bring emotion and individual biases to the investment process, which is exactly what our process is designed to shield us from. Our investment process is driven by numbers and math. When our quantitative model signals more stocks to buy than to sell – cash goes down. And, when the number of stocks ranked a sell outnumber those ranked a buy – cash goes up. It is never a “market” call, but rather action based on quantitative signals at the individual company level. For a frame of reference, the chart on the next page shows the historic cash levels within the Tandem Large Cap Core strategy over time. We have managed this strategy since 1991, and the Castle Tandem Fund is the mutual fund equivalent of the strategy.

As you can see, cash is dynamic in our strategy. It rarely stays in the same place for too long. Because in every market, there are companies that offer an attractive value and worth purchasing, and there are over-valued companies worth trimming. In any event, we will never invest cash for the sake of investing. Eventually cash will once again come down, but it will do so when our quantitative model signals an attractive opportunity to take a stake in a new company or add to an existing position, not before we get that signal.

The opinions expressed are those of the Fund’s Sub-Adviser and are not a recommendation for the purchase or sale of any security.
The Fund’s position in Microsoft as of June 30, 2020 represented 2.11% of Fund assets. The other securities mentioned in this report (Apple, Amazon, Facebook and Alphabet) are not holdings of the Castle Tandem Fund.
The Standard & Poors 500 Index (S&P 500) is an index of 500 stocks. The U.S. Consumer Confidence Index is an economic indicator used to measure the amount of optimism that U.S. consumers have about the U.S. economy.
The Fund’s investment objectives, risks, charges and expenses must be considered carefully before investing. The prospectus contains this and other important information about the Fund, and it may be obtained by calling 1-877- 743- 7820, or visiting www.castleim.com. Read it carefully before investing. Distributed by Rafferty Capital Markets, LLC Garden City, NY 11530.
The risks associated with the Fund are detailed in the Fund’s Prospectus. Investments in the Fund are subject to common stock risk, sector risk, and investment management risk. The Fund’s focus on large-capitalization companies subjects the Fund to the risks that larger companies may not be able to attain the high growth rates of smaller companies. Because the Fund may invest in companies of any size, its share price could be more volatile than a fund that invests only in large-capitalization companies. Fund holdings and asset allocations are subject to change and are not recommendations to buy or sell any security.
Comments are closed.