

Market Comments
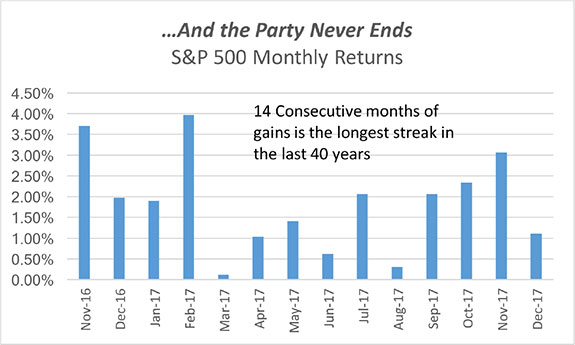
“The Road Goes on Forever, And the Party Never Ends.”
Robert Earl Keen
Houston-based singer-songwriter Robert Earl Keen penned what is arguably his most popular song under trying circumstances. It was 1988 and Keen was in Nashville preparing to record his third album. Keen was at a crossroad in his career — he had some minor successes, but his bank account balance was low and he had not yet broken out to a wider audience. Working with a very tight budget, he and his producer had scheduled studio-time over a four-day session. Just before recording began, Keen’s producer came to him with disheartening news — he didn’t think that Keen’s prospective album had a hit song. “I was living on nickels and dimes at the time,” Keen explained, and extending the costly studio time was not an option. Keen retreated to a friend’s backyard to reflect: Either quickly write a hit song or face the fact that his fledgling musical career might be at an end.
To download a PDF of this report, click here.
Keen wrote a song in his friend’s backyard and returned to the studio with “The Road Goes on Forever”1. The song tells the story of Sonny and Sherry, a small-town couple who become a modern-day Bonnie and Clyde. As circumstances darken throughout the song for Sonny and Sherry, each verse nonetheless ends with the strangely triumphant promise that “The Road Goes on Forever, and the Party Never Ends”. By the song’s end listeners know that is simply not true. Keen, now a member of The Texas Heritage Songwriters’ Association Hall of Fame, still ends nearly every live show with the song that has defined his highly successful career.
The S&P 500 closed 2017 with its 14th consecutive positive month. This is the longest monthly winning streak for the S&P 500 in the last 40 years. We wonder if some market participants, much like Sonny and Sherry, believe that the road goes on forever.
Streaks are Curiosities
As bottom-up value investors, the idea of focusing our time on short-term anomalies like monthly winning-streaks is foreign to us. Our investment process looks out further and uses independent research to assess companies based on their management skills, their business risk and their future cash flows. Nonetheless, the current streak has drawn our attention much like last year’s total eclipse.
Winning Streaks
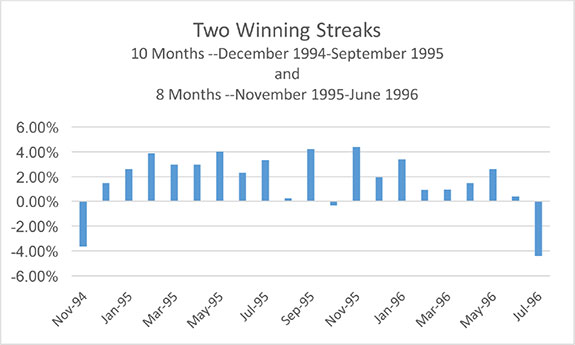
Again, this current winning streak of 14 months is the longest in the last 40 years. The previous longest winning streak within the last 40 years was ten months from December 1994 through September 1995. That ten month streak ended in October 1995 when the S&P 500 lost 0.36%. Interestingly, the S&P 500 then rattled off a new streak of eight months immediately thereafter. In short, the S&P nearly had a 19-month streak of positive returns from December 1994 through June 1996 if not for October 1995’s losing month. Instead the market advanced an incredible 18 of 19 months.
‘94-’95 Streak says “I was up for 18 of 19 months! No streak will ever match that!
Today’s Streak replies “Hold my Beer.”
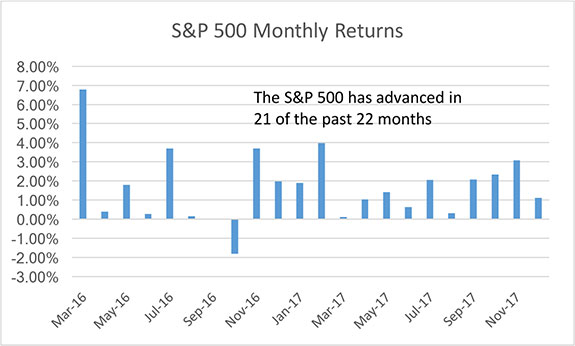
Of course the current market is not to be shown up by the second place streak’s 18 of 19 pace. This market’s ongoing streak of 14 months would in fact be a 22-month streak if not for October 2016. As of the end of 2017, the S&P 500 has advanced in 21 of the last 22 months.
The market’s current streak of fourteen consecutive months of gains is truly in a class by itself. While market winning streaks can be great for account values, we believe it is necessary to be prepared for the streak to eventually end. Winning streaks tend to make many investors forget that markets can move in the other direction.
The Flip Side
Sports fans and athletes know that the opposite of a winning streak is a slump. The end of a winning streak does not necessarily mean that a slump is set to begin. The Oakland A’s famously won 20 consecutive games in 2002. Once the streak was broken, however, the A’s continued their success and went on to win 15 of their next 22 games. Athletes fear slumps, and refuse to utter the word, because slumps appear unexpectedly and can drag on for extended periods of time. Slumps take on a life of their own and are persistent and sticky.
Athletes who have overcome slumps often say that the way out is to stick to your fundamentals: Don’t make radical changes to your stance, your grip, your swing, your mental approach to the game. Those fundamentals served you well through a variety of environments and will help you break the slump.
Investing is similar. Markets can suddenly shift at the most unexpected times from winning streaks to slumps. Sectors, asset classes and stocks that were hot can quickly fall out of favor. Investment managers can find themselves ‘chasing performance’ if they regularly change their process to include the stocks du jour. Chasing performance may feel great in the short-term, but we believe it is simply a losing formula over the long-term.
Our Investment Fundamentals — Price Discipline, Patience, and Managing Risk
Our investment fundamentals — like an athlete’s grip, stance and swing — remain the same regardless of the market environment. Our process is rooted in price discipline, patience, and managing risk. We believe that the price one pays for any investment is ultimately a key determinant of total return. We therefore allocate capital when we can buy at a discount to our estimate of fair value. To do so requires patience as investment opportunities that meet our criteria are often sparse. We strive to be patient because we view risk as the permanent loss of capital, not just a statistical measurements like beta and standard deviation. By staying true to our absolute return mindset, we believe that we provide Fund shareholders with a conservative, less dramatic approach to the equity markets.
It’s been said that fools and madmen call markets tops and bottoms. We are not market technicians and we don’t attempt to make broad market calls or forecast market movements. Nobody knows when this bull market or the S&P 500’s monthly winning streak will end. However, common-sense tells us that all parties must eventually end. We are fundamental value investors and we will continue to be disciplined, patient and thoughtful as we allocate shareholder capital. While other investors may fear a correction, we look forward to a market environment where we can be opportunistic buyers when markets are crowded with sellers. In the meantime, it appears that many other investors believe that the road goes on forever.
PORTFOLIO OVERVIEW
Buys and Sells
During the last quarter of 2017 we added Liberty Global (LBTYK, 2.27% of Fund assets as of 12/31/17), TJX Companies (2.19% of Fund Assets) and Axalta Coating Systems (1.05% of Fund Assets) to the Fund. We sold our position in Becton, Dickinson and Co. which was an original holding of the Fund. We also sold the Fund’s positions in Diageo and Praxair.
Cash
The Fund’s cash position (cash and cash equivalents) on December 31, 2017 was 33.96%, slightly lower than where we ended the prior quarter.
Risk and Volatility
For the five years ending December 31, 2017, the Fund’s beta was 0.52, roughly half that of the S&P 500. For the same period, our standard deviation was 6.11% versus a S&P 500 standard deviation of 9.49%. Up Capture versus the S&P 500 for the five year period was 55.61% and down capture was 54.45%.
Regards,
Regards,
![]()
Caeli Andrews
Managing Director
Castle Investment Management
![]()
Andrew Welle
Managing Director
Castle Investment Management
The opinions expressed are those of the Fund’s Adviser and are not a recommendation for the purchase or sale of any security.
The Standard & Poors 500 Index (S&P 500) is an index of 500 stocks. Beta is a measure of the Fund’s sensitivity to a benchmark or broad market index which has a beta of 1.00. Standard deviation is used to measure an investment’s historic volatility. The up capture and down capture ratios are statistical measures of a manager’s overall performance in upward moving and downward moving markets, respectively. We define a full-market cycle as a period of time, usually measured in years, that includes both ‘bearish’ markets (the market trends down) and ‘bullish’ markets (the market trends up).
The Fund’s investment objectives, risks, charges and expenses must be considered carefully before investing. The Prospectus contains this and other important information about the Fund, and it may be obtained by calling 1-877-743-7820, or visiting www.castleim.com. Read it carefully before investing.
The expense ratio excluding acquired fund expenses for the Investor Share Class is 1.34% (2.34% for Class C). The expense ratio including acquired fund expenses for the Investor Share Class is 1.41% (2.41% for Class C). Effective November 1, 2017 the Adviser has contractually agreed to waive Services Agreement fees by 0.24% of its average daily net assets through October 31, 2018. The Services Agreement fee waiver will automatically terminate on October 31, 2018 unless it is renewed by the Adviser. The Adviser may not terminate the fee waiver before October 31, 2018. The total expense ratio excluding the Services Agreement fee waiver for the Investor Share Class is 1.65% (2.65% for Class C).
The risks associated with the Fund, detailed in the Prospectus, include the risks of investing in small and medium sized companies and foreign securities which may result in additional risks such as the possibility of greater price volatility and reduced liquidity, different financial and accounting standards, fluctuations in currency exchange rates, and political, diplomatic and economic conditions as well as regulatory requirements in foreign countries. There also may be risks associated with the Fund’s investments in exchange traded funds, real estate investment trusts (“REITs”), significant investment in a specific sector, and nondiversification. Technology companies held in the Fund are subject to rapid industry changes and the risk of obsolescence. The Fund is non-diversified, meaning it may concentrate its assets in fewer individual holdings than a diversified fund. Therefore, the Fund is more exposed to individual stock volatility than a diversified fund.
Distributed by Rafferty Capital Markets, LLC-Garden City, NY 11530.